2025 Kazakhstan EV Charging Station Market Research Report
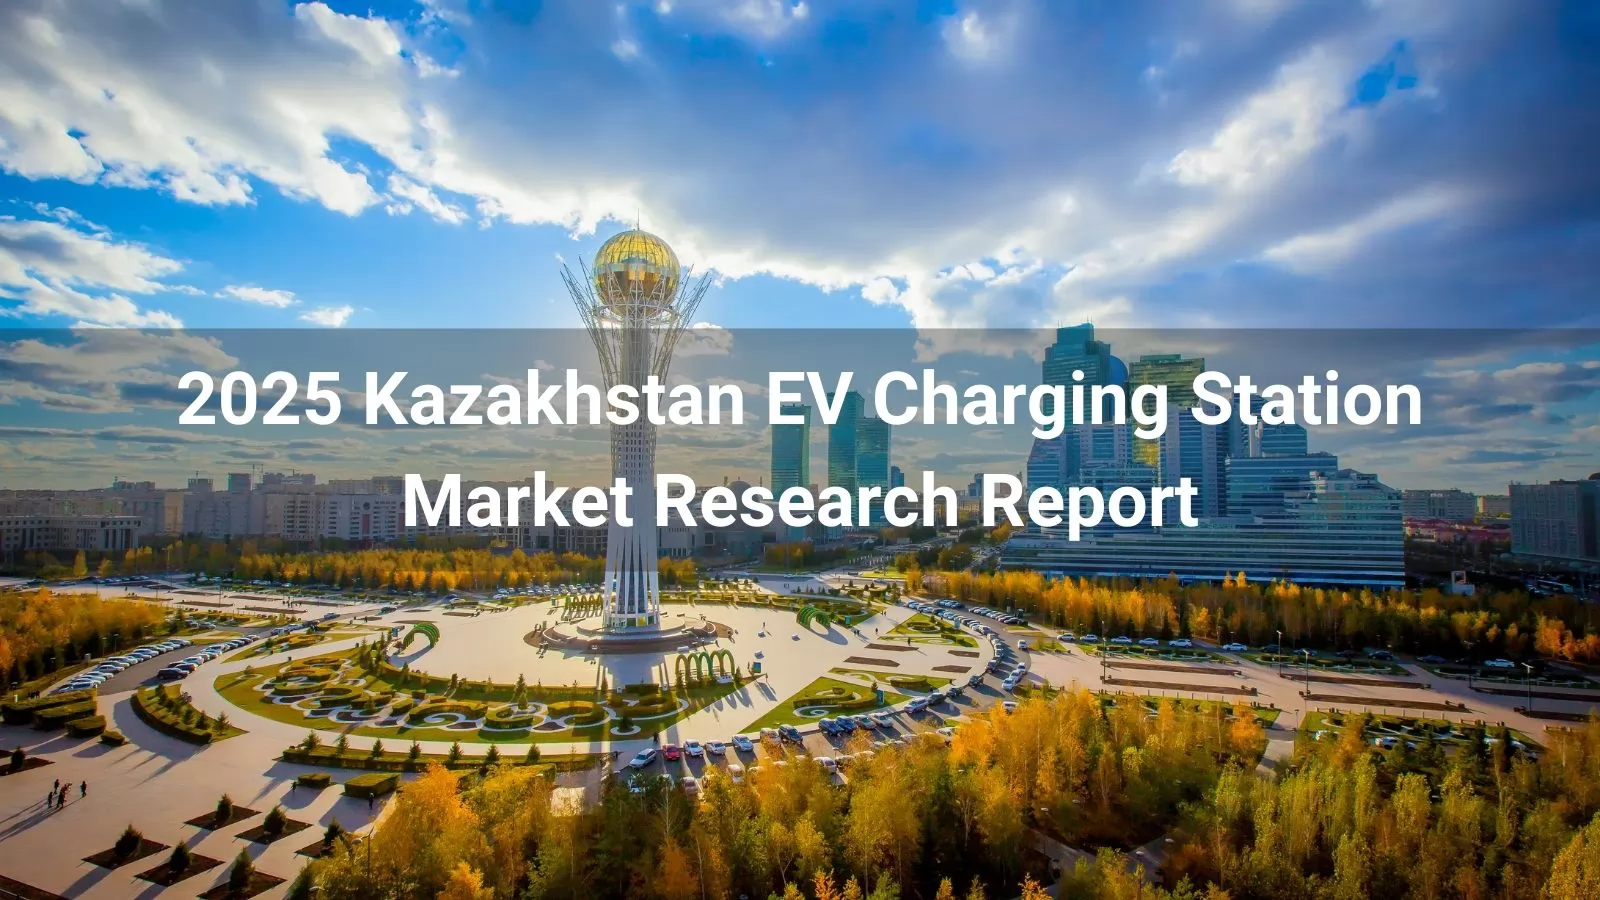
The 2025 Kazakhstan Electric Vehicle (EV) Charging Station Market Research Report provides a comprehensive analysis of the rapidly evolving EV infrastructure landscape in Kazakhstan. As the country accelerates its transition toward sustainable energy and green transportation, driven by government initiatives and growing environmental awareness, the demand for EV charging infrastructure is poised for significant growth. This report examines key market trends, regulatory frameworks, technological advancements, and competitive dynamics shaping the development of EV charging stations across Kazakhstan in 2025.
I. Market Overview: Dual Drivers of Policy and Demand
1. Market Size: From Niche Experimentation to Mainstream Growth
Underlying Drivers of Penetration Surge
According to the International Energy Agency (IEA), Kazakhstan’s new energy vehicle (NEV) penetration rate stood at just 0.8% in 2023 but is projected to exceed 3.5% by 2025 (annual sales: 12,000 units). This growth is driven by:
-
Policy Leverage: The government’s "Green Transport 2030" plan increases NEV purchase tax exemptions from 10% to 15%, coupled with subsidies of up to USD 7,000 per vehicle, directly stimulating consumer demand (Deloitte survey indicates subsidies account for 60% of sales growth).
-
Fuel Price Dynamics: Gasoline retail prices in Kazakhstan, linked to global oil markets, rose 18% YoY in 2023, while EV charging costs increased only 5%, widening the economic gap (Kazakhstan Ministry of Energy data).
Infrastructure Expansion: Quantity and Quality
Kazakhstan had approximately 600 public charging piles by end-2023, with 70% concentrated in Almaty and Nur-Sultan. By 2025, this number is projected to surpass 2,000, marked by two structural shifts:
-
Technology Upgrade: The share of 120kW+ DC fast chargers will rise from 45% to 60%, tripling service efficiency (based on Tesla’s Almaty Supercharger operational data).
-
Geographical Decentralization: The government plans to expand charging networks to 10 secondary cities (e.g., Aktau, Karaganda), increasing coverage from <10% to 30% (Asian Development Bank, Central Asia Green Infrastructure White Paper).
2. Demand Segmentation: Commercial Vehicle Boom vs. Residential Challenges
Commercial Vehicles: Policy-Driven Growth
-
Electric Buses: Under the 2025 "Clean Air Initiative," 50% of new buses must be electric, with subsidies up to USD 15,000 per vehicle. Chinese firms Yutong and BYD have secured orders for 200 electric buses in Nur-Sultan, driving concentrated demand for配套 charging infrastructure.
-
Logistics Cost Efficiency: For the Almaty-Shymkent freight route, electric light trucks reduce daily energy costs to 1/3 of diesel equivalents, shortening payback periods to 2 years (Kazakhstan Logistics Association analysis).
Residential Charging: Untapped Long-Tail Market
Despite rapid public charging expansion, residential penetration remains below 15%, primarily due to:
-
Grid Constraints: Outdated residential circuits (7kW max load) cannot support 11kW home chargers without costly upgrades (avg. USD 1,200).
-
Policy Misalignment: Current USD 500 installation subsidies cover only hardware costs, leaving users to bear service fees (avg. USD 800), resulting in a <30% subsidy utilization rate.
II. Policy Analysis: Transitioning from Subsidies to Ecosystem Building
1. Fiscal Tools: Targeted Market Incentives
Tiered Subsidy Structure
|
Vehicle Category |
Subsidy Amount |
Application Scope |
|---|---|---|
|
Battery Electric Vehicles (BEVs) |
Up to USD 7,000 |
Personal purchases (with trade-in) |
|
Electric Buses |
USD 15,000/unit |
Municipal tenders (≥40% localization) |
|
Electric Logistics Vehicles |
USD 8,000/unit |
Fleet purchases (≥10 units) |
-
This policy reduces the effective price of models like BYD Atto 3 to USD 21,000 (post-subsidy), undercutting gasoline competitors (e.g., Toyota RAV4 at USD 23,000).
2. Infrastructure Support: Public-Private Partnership (PPP) Innovation
-
Risk-Sharing Mechanism: The government offers 30% investment subsidies for charging pile projects and guarantees an 8% minimum return during the first three operational years (Kazakhstan Ministry of Finance: Green Infrastructure PPP Guidelines).
-
Land Prioritization: Core areas (e.g., Almaty, Nur-Sultan) offer 50% rent reductions and expedited permitting (12 months → 3 months).
III. Competitive Landscape: Foreign Dominance vs. Local Resilience
1. Foreign Players: Technology-Driven Market Capture
Tesla: Premium Segment Control
-
Product Strategy: The Model Y (USD 45,000) targets high-net-worth individuals, supported by V4 Superchargers (200 km range in 5 minutes), capturing 70% market share on the Almaty-Nur-Sultan highway.
-
Ecosystem Lock-In: Non-Tesla vehicles face a 20% surcharge via OTA protocol updates, reinforcing exclusivity.
Chinese Contenders: Cost Leadership + Localization
-
BYD: Joint venture with Astana Motors for localized Atto 3 production (25% cost reduction), featuring cold-optimized Blade Batteries (-30°C range loss ≤15%).
-
Anari Energy: Leverages China-Europe Railway Express for pre-assembled charging modules, slashing delivery cycles from 45 to 18 days.
2. Local Firms: Policy-Backed Niche Play
-
KZ Charging: Government-Aligned "Silent Leader"
-
Bid Advantages: Wins 80% of public charging tenders in secondary cities by meeting "60% localization" requirements.
-
Technology Gaps: Reliance on imported IGBT modules (China) limits margins to 12% (vs. industry avg. 25%).
-
IV. Risks & Opportunities: Navigating Market Cycles
1. Gray Rhino Risks
-
Grid Capacity Crisis: KEGOC (Kazakhstan’s grid operator) estimates a 200MW peak-hour power deficit by 2025 if 2,000 charging piles are deployed. Mitigation strategies include:
-
Time-of-Use Pricing: Peak-hour (18:00–22:00) charging fees increased by 50% to shift demand.
-
Mandatory Energy Storage: New stations must allocate 20% capacity to storage systems (e.g., CATL containerized solutions).
-
-
Standard Fragmentation: Competing charging protocols (CCS2, GB/T, CHAdeMO) result in:
-
Underutilization: Some chargers average <5 daily sessions (industry avg.: 15).
-
OEM Alignment Costs: Hyundai’s 2025 CCS2-exclusive strategy forces operators to retrofit infrastructure.
-
2. Strategic Opportunities: From Hardware to Services
-
Integrated PV-Storage-Charging Solutions
|
Metric |
Traditional Charging Station |
Integrated PV-Storage-Charging Station |
|---|---|---|
|
Capex (USD) |
500,000 |
800,000 |
|
Electricity Cost (USD/kWh) |
0.10 (grid) |
0.03 (self-generated) |
|
Payback Period |
4–5 years |
3–3.5 years |
-
Case Study: Huawei and Samruk Energy’s "Zero-Carbon Charging Station" in Almaty uses rooftop PV and storage to meet 100% daytime demand, slashing levelized costs by 60%.
-
Vehicle-to-Grid (V2G): Monetizing User-Side Resources Kazakhstan’s energy regulator is piloting V2G policies, allowing EVs to sell surplus power during peak hours (30% price premium). BYD’s V2G-compatible models enable annual user earnings of USD 500.
V. Strategic Recommendations: Securing High-Value Scenarios
1. Short-Term (2025–2025): Harvest Policy Dividends
-
Target Public Transit & Logistics Hubs: Bid aggressively for Almaty’s 2025 Phase II tender (100 fast chargers), requiring bundled energy storage (20% additional subsidy).
-
Asset-Light Rural Expansion: Partner with local gas stations/convenience stores to deploy 7kW slow chargers (Capex < USD 10,000 per unit) under revenue-sharing models (50/50 split).
2. Long-Term (2026–2030): Ecosystem Dominance
-
Technology Consortiums: Forge alliances with CATL and Huawei Digital Power to establish a "Central Asia New Energy Alliance," shaping regional standards (e.g., "Central Asia GB/T").
-
Financial Innovation: Launch "Green Infrastructure REITs" to securitize charging assets, attracting pension funds and sovereign wealth capital.
VI. Core Data Summary
|
Metric |
2023 Baseline |
2025 Projection |
Key Assumptions & Sources |
|---|---|---|---|
|
NEV Sales (units) |
2,800 |
12,000 |
IEA model, assuming subsidy continuity |
|
Public Charging Piles |
600 |
2,000 |
ADB infrastructure investment tracker |
|
DC Fast Charger Share |
45% |
60% |
McKinsey technology roadmap |
|
Residential Charging Penetration |
15% |
30% |
Kazakhstan Housing Ministry initiatives |
|
Charging Service Gross Margin |
22% |
28% |
Deloitte cost model (scale economies) |
Read more:


Your Name*
Your Email*

You Might Also Like...
-
Global EV Charging Infrastructure Market Landscape: 2025-2030
The global EV charging market is transitioning from being "policy-driven" to "dual policy-and-market-driven," with intensifying regional divergence: Southeast Asia is benefiting from manufacturing relocation, resource-rich Latin American countries are accelerating electrification, energy giants in the Middle East and Africa are diversifying into new energy, and the European market is entering the advanced stage of standardization and smart charging.2026 Mar,06 -
Overview of the Electric Vehicle and Charging Market in Central Asia
This article aims to provide a comprehensive overview of the current situation, infrastructure, policy environment, market challenges and opportunities, as well as industry associations in the electric vehicle and charging market of Central Asia.2026 Feb,05 -
Overview of the Australia Electric Vehicle and EV Charging Market
Australia's electric vehicle (EV) market is rapidly expanding, with Tesla leading the high-end segment and Chinese brands like BYD gaining traction among mid-to-low-end consumers.2026 Feb,05