



1. EV Charging Station ROI: Distrust the Word “Average”
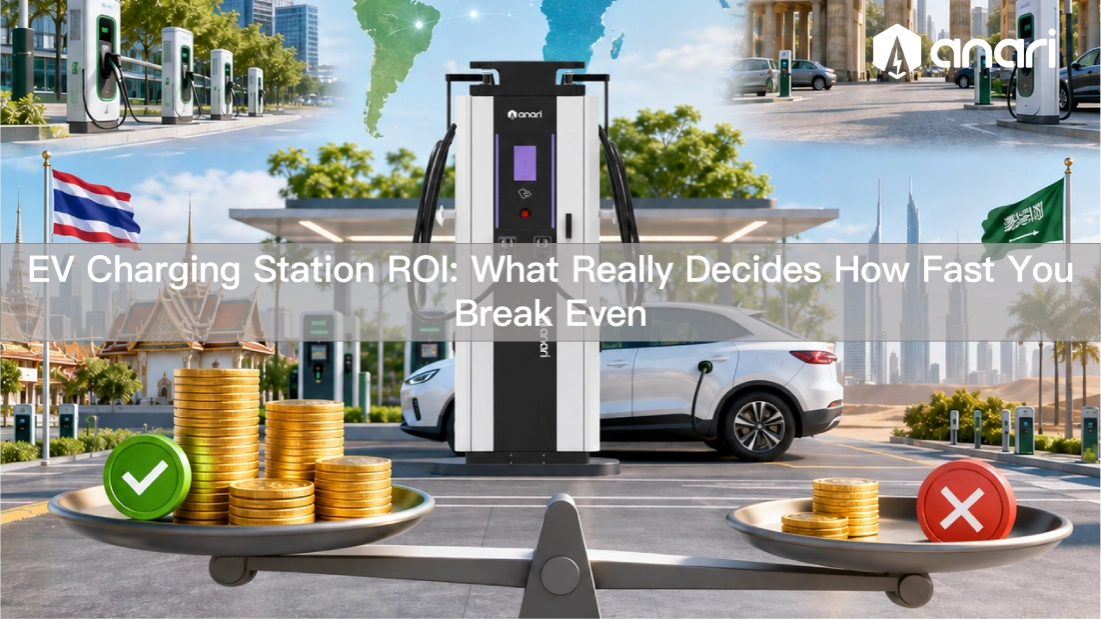
The question every investor asks first: how many years until a charging station pays for itself? The honest answer is that nobody knows, because no credible global average exists. Any figure that promises “X years to payback” is either scoped to one market and business model, or suffers from survivorship bias. Losing stations do not publish their accounts. The basis problem runs deeper: AC and DC, destination charging and en-route fast charging, subsidised and fully merchant projects, sit in different orders of magnitude. Treating “charging stations” as one asset class is itself the mistake.
Regional samples in published research tell the story better than any average.
Europe: a 2026 analysis focused on the Netherlands and Germany finds that European public DC charging networks average roughly 8% utilisation across portfolios, against a widely cited 15% break-even threshold. At portfolio level, most sites have not crossed the line. The capital side tells the same story: Interpath estimates Europe has deployed roughly EUR 35-45 billion in charging infrastructure with rollout outpacing EV adoption, capital arriving ahead of utilisation and leaving portfolio break-even elusive.
Germany: RWTH Aachen modelled 22,000 public stations with 2019-2021 usage data and found that even under optimistic operating cost and interest assumptions, only about 59% of 100-200 kW fast chargers break even from electricity sales alone; for 25-100 kW units the share drops to 16%.
Norway: SINTEF’s 2025 study of actual fast-charging usage, in one of the world’s most mature EV markets, found a significant share of public stations already profitable under current usage, with pricing the single most influential factor and funding support pushing almost all stations into profit.
Southeast Asia: two 2025 Thai studies report that small sites with one to three chargers reach internal rates of return of 24-40% with three-to-four-year paybacks, while sites with more than three chargers see payback stretch and some configurations never recover their investment within the project horizon.
GCC: Roland Berger’s 2025 charging index shows a region still in early adoption, with the UAE leading, where building stations is strategic positioning more than cash-flow business.
The point of laying these side by side is not which number is right. EV charging station ROI is decided by model and location, and a market average stops meaning anything as soon as you change either.
2. The Three Variables That Decide Payback
Utilisation. Payback is strongly nonlinear in utilisation. Simplified: payback ≈ total investment ÷ (utilisation × margin per kWh − fixed costs). Site rent, staff, platform and maintenance do not shrink when energy sales drop. When utilisation is so low that margin only covers fixed costs, payback approaches infinity. Once you cross the break-even point, every extra kWh sold is almost pure incremental profit and payback collapses. That is the gap between the European portfolio average of 8% and the 15% threshold that decides which sites survive. Germany’s data shows break-even shares varying several-fold by power class: utilisation is not evenly distributed, it is set by location, and location comes before everything else.
One trap repeats in almost every model: time utilisation is not energy utilisation. A stall can be occupied 80% of the day while delivering only 30% of rated power, long single-vehicle sessions at low power, high occupancy, low output. Separate occupancy from energy throughput in your model, and account for how twin cables and power sharing change the time each vehicle blocks a stall.
Electricity cost. Electricity is the largest variable cost and the biggest structural variable. A 2025 IEEE Access study in Thailand modelled two tariff structures for the same station: a fixed energy-cost contract delivered an IRR of 14.55% with a four-year payback; a variable price structure cut the IRR to 7.28%. Same site, same utilisation, double the return, purely from electricity contracting. Two traps repeat across emerging markets: commercial tariffs that bill peak demand or contracted capacity, which punish the bursty load profile of fast charging; and wholesale price swings that cannot be passed through to the retail price fast enough, quietly eroding margin. Sites that lock an EV-specific tariff or a fixed-price power contract trade return uncertainty for certainty. The reverse also holds: fixed pricing can lock out future falls in power prices, and the same research notes variable structures can win when electricity gets cheaper.
Initial investment. Most people price only the hardware. Experience puts equipment at roughly 40% of total installed cost, with transformer, grid connection, civil works and permitting dominating the rest, and site conditions move that share widely. Emerging markets add import duties, certification, logistics and local stocking. Early-stage markets often offer public funding that covers part of the capital bill: include it in the model, but never assume it lasts forever. Thai research adds a counterintuitive result: adding chargers dilutes per-stall utilisation and scales up capital and operating cost, so larger sites can pay back slower than smaller ones. In an early market, fewer, busier stalls beat a bigger, emptier site.
3. Routes That Actually Shorten Payback
Site selection: count real traffic, not potential traffic. Utilisation is chosen, not designed. Look for existing flows: highway corridors, logistics and fleet nodes, ride-hailing and taxi depots, hotels and retail with dwell time. Then decide what the site is for: en-route fast charging lives on turnover, destination charging lives on dwell and non-charging spend, and the two need different hardware, stall counts and pricing. Then look at the grid: how fast can you connect and at what price? The Netherlands and Germany show connection queues beyond 36 months in exactly the zones with the strongest utilisation potential; capital sitting on an unenergised asset erodes payback with every extra year of queue. Leases belong in the same model: a site lease shorter than the equipment life or the projected payback turns the asset into a liability when the owner declines to renew or an anchor tenant leaves. One caution: traffic is not charging demand. In new markets, validate a site with charging intent, not with petrol-station traffic counts.
Non-charging income: make the same kWh pay twice. Charging margin is thin, but charging creates dwell time. A lounge, convenience store or food offer earns a second margin on the same visit, and retail margins usually sit far above charging margins. For a hotel, the charger is first an acquisition and booking tool; the payback belongs in the occupancy ledger, not the charger’s cash flow. One accounting caution: non-charging revenue must carry its own costs, staff, rent, shrinkage, or the project math is fiction.
Solar and storage: run the numbers before you add them. Solar value depends on self-consumption share; sites that charge heavily during daylight, fleet yards and retail, benefit most, while low self-consumption stretches payback sharply. Storage earns its keep in three situations only: high demand or capacity charges, large peak-valley price spreads, or constrained grid capacity, where distributed batteries turn “cannot connect” into “deployable”, an architecture option in congested European markets. Storage capacity is not storage value: size power and discharge duration against the demand window that hurts your bill, not against marketing brochures. In low-power-price markets, such as parts of the Gulf, the payback logic is different entirely; compute levelised costs before deciding. Storage and solar optimise the electricity bill. They do not fix utilisation.
Control demand charges. Stagger sessions with load management and power sharing, shave peaks with storage, negotiate EV-specific tariffs and contract capacity. Fast charging is short and concentrated; one 15-minute peak can anchor an entire month’s bill. In emerging markets, priority number one is a fixed-price or dedicated EV tariff: the Thai evidence shows electricity structure alone can double IRR.
Use one accounting basis for ROI. The same project can show two different payback periods depending on the basis chosen. Three mistakes repeat. Counting only hardware capital instead of the full project including grid, civil works, soft costs and early operating losses. Counting only charging revenue and missing non-charging and policy income: under the EU’s RED III, member states must create credit mechanisms where CPOs earn tradable credits from electricity delivered, a real revenue line in Europe. Using arbitrary depreciation lives: German research models an eight-year equipment life, so apply one life and one residual-value assumption to every option you compare. Before you trust any payback figure, answer three questions: where does the utilisation assumption come from? How long is the electricity contract locked? Does the investment number include grid and soft costs?
4. Conclusion
There is no global average payback period. There is only the payback of your project at a specific site, under a specific electricity contract, at a specific utilisation level. Utilisation comes from site selection, electricity cost comes from contract structure, and capital discipline comes from design restraint. Do those three right and payback becomes an outcome. Stare only at the hardware price and payback becomes a gamble.
Data note: All data layer figures come from Europe and emerging-market research: European DC portfolio utilisation and the 15% break-even threshold (Connection Queue, Zenodo, 2026); Germany 22,000-station empirical study (iScience/RWTH Aachen, 2022); Norway fast-charging profitability (SINTEF, 2025); Thailand tariff-structure and scale studies (IEEE Access 2025; Energy Strategy Reviews 2025); GCC adoption stage (Roland Berger EV Charging Index 2025). Judgment layer: the simplified payback formula, the “roughly 40% hardware share” and the accounting traps are illustrative frameworks, not data, and should be replaced with project figures. Electricity prices, subsidies and labour costs vary widely; validate locally.