




Table of Contents
The transition to electric mobility has moved past early adoption and is now a central pillar of facility management, real estate development, and corporate operations. As property owners and business leaders scramble to accommodate the influx of electric vehicles (EVs), the most critical and technically demanding hurdle they face is electrical capacity planning.
Understanding how to accurately calculate your site’s energy requirements is the foundational step in deploying a resilient charging network. A miscalculation in this phase can be disastrous. Oversizing your electrical components leads to bloated capital expenditures and massive, ongoing utility demand charges. Conversely, undersizing results in tripped breakers, frustrated users, and a crippled operational workflow.
Deconstructing EV Charging Hardware and Electrical Fundamentals
Before calculating load, it is imperative to understand the relationship between voltage, amperage, and kilowatt (kW) output. These three metrics dictate how much energy your building must supply and how quickly a vehicle will recharge.
Table 1: Technical Breakdown of Commercial Charging Tiers
| Charging Tier | Voltage & Phase Required | Typical Amperage Draw | Power Output Range (kW) | Estimated Range Added (Per Hour) | Ideal Commercial Application |
| Level 1 | 120V (1-Phase) | 12A – 16A | 1.4 kW – 1.9 kW | 3 – 5 miles | Long-term transit parking (airports), overnight employee garages. |
| Level 2 | 208V or 240V (1-Phase) | 32A – 80A | 6.6 kW – 19.2 kW | 20 – 40 miles | Office parks, retail centers, hotels, multi-family residential, standard depots. |
| DC Fast Charging | 480V+ (3-Phase) | 100A – 500A+ | 50 kW – 350+ kW | 150 – 1000+ miles | Highway corridors, short-stay retail (convenience stores), heavy-duty transit. |
For over 80% of commercial deployments, Level 2 is the optimal choice. It provides a perfect equilibrium between meaningful charging speeds and manageable electrical demands. DC Fast Charging (DCFC) requires monumental grid support and is typically reserved for specialized, high-turnover business models.
Analyzing User Dwell Time and Driver Profiles
The secret to accurate EV charging power sizing is not just looking at the hardware, but deeply analyzing human behavior. The amount of power you need is directly inverse to the amount of time the vehicle spends parked. This metric is known in the industry as “Dwell Time.”
The Long-Dwell Scenario: Workplaces and Multi-Family Housing
In an office building or an apartment complex, vehicles are typically parked for 8 to 12 hours. Because the dwell time is exceptionally long, you do not need to provide high-speed power.
- The Math: An EV commuter drives an average of 40 miles per day. To replenish 40 miles, the car needs roughly 12 to 15 kWh of energy. Over an 8-hour workday, a charger only needs to output about 2 kW per hour to satisfy the driver.
- The Strategy: Instead of installing high-powered 11.5 kW stations, properties can install more stations running at lower amperages, maximizing the number of parking spots covered without triggering expensive utility upgrades.
The Medium-Dwell Scenario: Retail, Dining, and Hospitality
Shopping malls, supermarkets, and restaurants see dwell times ranging from 45 minutes to 3 hours. Customers expect a meaningful battery top-up—often a “convenience charge” that gets them to their next destination.
- The Strategy: Higher-powered Level 2 chargers (typically 48 Amps delivering 11.5 kW) are highly recommended here. If your retail center has a coffee shop or quick-service restaurant where users stay for 15-30 minutes, deploying a 50 kW DC Fast charger can act as a powerful magnet for high-income EV drivers.
The Strict-Dwell Scenario: Commercial Depots
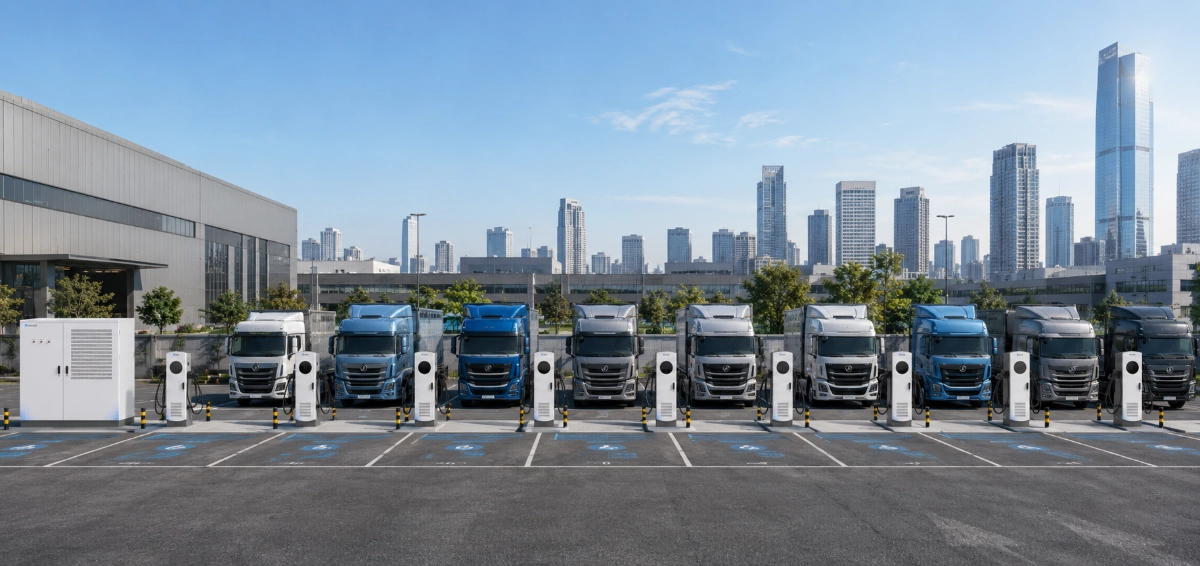
When designing fleet charging solutions, the power calculations must be exact. If a fleet of electric delivery vans returns to the depot at 8:00 PM and must be fully dispatched by 5:00 AM, you have a rigid 9-hour operational window. Facility managers must calculate the exact battery capacity of the vans, subtract the state-of-charge upon return, and divide the required energy by the 9-hour window to determine the precise kW output needed per pedestal.
The Mathematical Framework for Continuous Load Calculations
Once you have identified your hardware and user profiles, you must translate those requirements into actionable electrical engineering data. In North America, the National Electrical Code (NEC) governs how this power is calculated, and similar regulatory frameworks exist globally (such as the IEC standards in Europe).
A fundamental rule for electric vehicles is that they are classified as “Continuous Loads.” This means the vehicle will draw its maximum electrical current for more than three hours. Consequently, safety regulations dictate that the electrical circuit must be sized at 125% of the charger’s maximum draw to prevent overheating and fire hazards.
Step-by-Step Load Calculation
Let us assume you are outfitting a commercial parking garage with six Level 2 chargers. You have selected standard commercial units that operate at 208 Volts and draw 32 Amps.
- Calculate Individual Charger Power (kW):
- Formula: Volts x Amps / 1000 = kW
- Calculation: 208V x 32A / 1000 = 6.65 kW per charger.
- Calculate Total Continuous Power Load:
- Calculation: 6.65 kW x 6 chargers = 39.9 kW total load added to your building.
- Calculate Required Circuit Breaker Size (The 125% Rule):
- Formula: Maximum Amperage Draw x 1.25 Safety Factor
- Calculation: 32 Amps x 1.25 = 40 Amp circuit breaker required for each charger.
- Total Panel Requirement: You will need a subpanel capable of safely supporting 240 Amps of continuous EV load.
This calculation proves why adding EV stations is not as simple as plugging into an existing wall outlet; it requires dedicated, heavy-duty electrical infrastructure.
Conducting a Comprehensive Site Energy Audit
Before purchasing a single piece of hardware, a thorough Site Energy Audit is mandatory. This must be conducted by a licensed electrical engineer or a master electrician. Skipping this step is the most common reason projects face massive delays and unexpected EV charger installation costs.
The Three Pillars of an Energy Audit
- Historical Peak Load Analysis:
The engineer will request 12 to 24 months of utility data from your energy provider. They are looking for your building’s highest historical power draw. If your main electrical switchgear is rated for 1000 Amps, and your historical peak during a hot summer day (with HVAC running at maximum) was 750 Amps, your building theoretically has 250 Amps of spare capacity. - Physical Switchgear Inspection:
The engineer will physically inspect your main electrical panels to ensure there is physical space to add new breakers. They will also assess the age and degradation of the wiring to ensure it can handle constant, high-heat continuous loads. - Utility Transformer Assessment:
Even if your building’s panel has 200 Amps of free space, the utility-owned transformer on the street might be operating at 99% capacity. If your new EV load pushes that transformer over its limit, the utility company will force you to pay for a transformer upgrade—a process that can cost anywhere from $25,000 to $100,000 and take 6 to 12 months to complete.
Overcoming Grid Limitations with Smart Technology
What happens if your energy audit reveals that you only have 80 Amps of spare capacity, but your business objectives require outfitting 10 parking spaces? In the past, this would trigger an immediate halt to the project or require a six-figure electrical overhaul.
Today, the industry standard solution is Dynamic Load Management (DLM), sometimes referred to as smart charging or load sharing.
How DLM Maximizes Infrastructure
DLM is an intelligent software protocol integrated into networked, commercial-grade chargers. It communicates via Wi-Fi, 4G, or hardwired Ethernet to a central cloud server, continuously monitoring the total power being consumed by all active charging stations.
Table 2: The DLM Efficiency Matrix
| Scenario (100A Dedicated Circuit Limit) | Without DLM Technology | With DLM Technology |
| Maximum Chargers Installable | 2 Chargers (at 40A each) | 10 Chargers |
| Power Distributed (1 Car Plugged In) | 40A | 40A |
| Power Distributed (4 Cars Plugged In) | System Overload / Breaker Trips | 20A per car (evenly distributed) |
| Power Distributed (10 Cars Plugged In) | Impossible | 8A per car (slow, steady trickle charge) |
Because it is incredibly rare for all ten cars to arrive at the exact same minute with completely empty batteries, the software dynamically shifts power in real-time. When Car A reaches a full battery, it stops drawing current, and the DLM software instantly redistributes Car A’s power allocation to Cars B, C, and D. This allows facility managers to maximize their existing electrical footprint without expensive grid upgrades.
Financial Strategy: Navigating Demand Charges
When discussing commercial EV infrastructure, facility managers must understand that commercial electricity billing is fundamentally different from residential billing.
Residential users pay for the total volume of energy used (measured in kilowatt-hours, or kWh). Commercial users pay for volume (kWh) plus the peak rate of energy drawn at any single 15-minute interval during the month. This is known as a Demand Charge (measured in kilowatts, or kW).
The Demand Charge Danger
If your site installs two 50 kW DC Fast Chargers, and two vehicles initiate a charging session simultaneously, your building’s peak demand instantly spikes by 100 kW. If your utility company levies a demand charge of 20 per kW, those two vehicles just added $2,000 to your monthly utility bill—even if the charging session only lasted 20 minutes.
Mitigation Tactics
To protect your return on investment (ROI), you must implement demand response strategies:
- Software Power Capping: Program your charging network to artificially limit power output between 2:00 PM and 6:00 PM, which is when commercial energy rates are typically highest.
- Time-of-Use (TOU) Pricing: Incentivize drivers to charge overnight by offering cheaper charging rates after 9:00 PM.
- Battery Energy Storage Systems (BESS): For larger sites, installing on-site lithium-ion batteries allows the property to slowly store cheap energy at night and discharge it into the EVs during peak daytime hours, entirely shielding the building from grid demand spikes.
Future-Proofing: The “Make-Ready” Approach
The electric vehicle market is rapidly evolving. Battery packs are getting denser, and vehicles are being engineered to accept faster charging speeds. Designing your site solely for today’s standard is a strategic misstep that will result in duplicate labor costs in the future.
The most cost-effective way to scale is adopting a “Make-Ready” infrastructure methodology.
The most expensive phase of EV charger installation costs is the civil engineering work: trenching through concrete, laying conduit, and repaving asphalt. If your current budget only allows for purchasing four charging pedestals, you should still mandate that your contractors lay underground conduit and pull wiring sized to support twenty pedestals.
When you need to expand in three years, the groundwork is already complete. You simply pull new wire through the oversized PVC pipes, bolt the new chargers to the concrete, and turn them on. Similarly, if your load calculations dictate a 200-Amp subpanel today, pay the marginal upgrade fee to install a 400-Amp panel, leaving the extra breaker slots empty for future expansion.
Conclusion
Accurately determining your electrical needs is a multi-disciplinary effort that blends electrical engineering, behavioral psychology (driver habits), and financial strategy. By rigorously auditing your current electrical capacity, categorizing your drivers’ dwell times, and leveraging intelligent load-sharing software, you can deploy an EV charging network that is highly scalable and economically viable. Proper EV charging power sizing ensures that as the wave of electric mobility continues to crest, your commercial site remains a destination of choice, unburdened by unnecessary operational costs or electrical failures.
FAQs
How does dynamic load management (DLM) interact with utility demand charges?
While dynamic load management is primarily designed to prevent local circuit breakers from tripping, it is also a powerful tool for managing demand charges. Advanced DLM software allows facility managers to set a hard “site limit” (e.g., capping the entire EV charging network at 50 kW total). Even if ten cars plug in, the software will throttle the vehicles to ensure the total power draw never exceeds 50 kW, strictly controlling your peak demand and preventing unexpected utility bill spikes.
Can I offset the power needed for my commercial chargers by installing solar panels?
Integrating a solar photovoltaic (PV) canopy over your parking lot is an excellent sustainability initiative, but it cannot replace the need for robust grid power sizing. Solar generation is intermittent; if a cloud passes over or if it is night time, the EVs still require a massive, uninterrupted flow of electricity. To genuinely offset grid reliance, solar arrays must be paired with commercial Battery Energy Storage Systems (BESS) that capture daytime solar energy and discharge it to the vehicles steadily, regardless of weather.
What is the difference between Level 2 charging for a workplace and Level 2 charging for a commercial fleet?
The hardware itself may look identical, but the power requirements and software integration are vastly different. Workplace charging is a perk; if a charger goes offline or delivers power slowly due to load sharing, the employee is mildly inconvenienced. Fleet charging solutions are mission-critical. Fleet depots usually require dedicated circuits without heavy load-sharing throttling to guarantee that every delivery van reaches 100% battery before the morning shift. Fleet software also integrates directly with telematics to prioritize charging for vehicles with earlier dispatch times.