



1. The Demand Charge Trap: Why Your Electricity Bill Hides a Killer
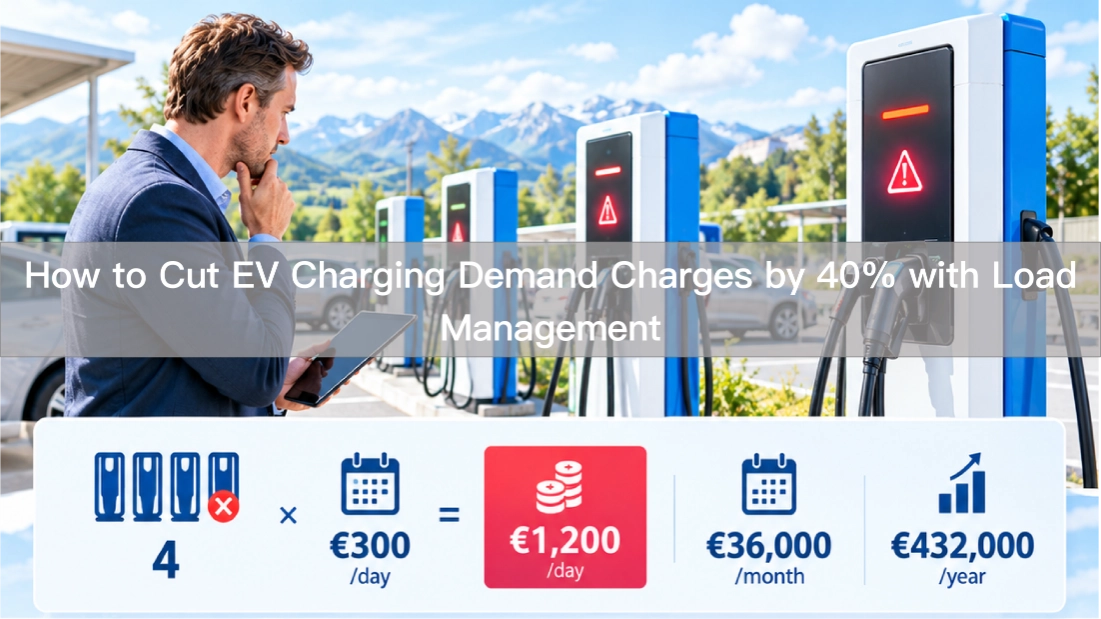
A CPO in Italy reviewed their monthly electricity bills and discovered something alarming: demand charges-fees based on peak power draw-accounted for 35% of their total energy costs. At a 400kW station drawing 380kW during peak hours, the utility charged $15/kW demand fee, adding $5,700/month or $68,400/year to operating costs.
This isn’t an isolated case. Across markets with time-of-use pricing and demand-based billing, CPOs routinely overlook how charging patterns create costly peak events. A single 15-minute peak can dominate the monthly demand charge-meaning efficient chargers and competitive pricing mean nothing if your grid connection costs spiral.
Smart load management doesn’t just reduce bills; it transforms the economics of station operation. Properly implemented, it cuts demand charges by 30-50%, extends transformer life, defers infrastructure upgrades, and maintains-or even improves-driver experience.
2. Understanding Demand Charges: The Hidden Cost Driver
Electricity pricing for commercial EV charging typically combines two components:
Energy charge. Cost per kWh consumed ($0.08-0.25/kWh depending on market). This is the variable cost drivers understand-each kWh delivered has a cost.
Demand charge. Cost per kW of peak power drawn during a billing cycle ($5-25/kW). This fixed cost reflects the utility’s investment in grid infrastructure to serve your peak demand-even if you only draw that peak for 15 minutes monthly.
The critical insight: Demand charges are based on your highest 15-minute average power draw each month. Ten Chargers full power simultaneously might create a 600kW peak, but if only four charge at full power concurrently, the peak drops to 480kW-and your demand charge falls proportionally.
3. Load Management Strategies That Work
3.1 Strategy 1: Dynamic Power Allocation
Instead of fixed 150kW per charger, intelligent systems distribute available power across connected vehicles:
Available power: 600kW
Vehicle A requests: 150kW (battery 20% SOC, needs fast charge)
Vehicle B requests: 100kW (battery 60% SOC, moderate charge)
Vehicle C requests: 80kW (battery 80% SOC, tapering)
Vehicle D: Not yet connected
Dynamic allocation:
– Vehicle A: 150kW (full request satisfied)
– Vehicle B: 120kW (slightly above request-fast session)
– Vehicle C: 90kW (above request-quick top-up)
– Vehicle D: Connected, requests 100kW
– Total now: 460kW (well below 600kW limit)
This approach maintains driver satisfaction (most get full or near-full power) while keeping aggregate demand well below transformer capacity.
3.2 Strategy 2: Time-Based Scheduling
For fleet operations with predictable schedules, pre-program charging windows:
– Off-peak overnight: Full power available, lowest electricity rates
– Midday solar overlap: Solar generation offsets grid import
– Evening peak avoidance: Reduce or pause charging during highest-demand periods
Fleet operators with depot operations often see 40-60% demand charge reduction simply by shifting charging to off-peak hours.
3.3 Strategy 3: Priority Queuing
When multiple vehicles arrive simultaneously, prioritize based on business rules:
– Fleet vehicles over public users (higher margin, contractual obligations)
– Low SOC vehicles over near-full batteries (urgent need vs. convenience)
– Longer dwell-time users over quick top-ups (predictable sessions enable better planning)
Priority systems ensure valuable sessions complete while managing overall demand.
3.4 Strategy 4: Thermal and Battery Protection Throttling
Modern chargers can intelligently reduce power when:
– Power module temperature approaches limits
– Battery acceptance rate naturally tapers (most EVs accept >80% power below 80% SOC, then taper)
– Grid conditions require curtailment
Throttling during these conditions prevents trips and extends equipment life while reducing peak demand.
4. Real Case: Romanian Fleet Depot
Site: Bus depot, Bucharest, Romania
Configuration: 12x 150kW DC chargers, 800kVA transformer
Previous operation: All chargers available simultaneously, frequent 900kW+ peaks triggering demand charges
Load management implementation:
– Smart charging system with 600kW aggregate limit
– Priority queue: buses first, service vehicles second
– Time-based limits during 14:00-20:00 peak hours
– Thermal management preventing module overload
Results after 6 months:
| Metric | Before | After | Change |
| Peak demand | 920kW | 580kW | -37% |
| Monthly demand charge | $13,800 | $8,700 | -37% |
| Annual demand charge savings | —— | $58,800 | —— |
| Average charge session time | 42 min | 48 min | +14% |
| Driver satisfaction score | 4.2/5 | 4.1/5 | -2% |
The 14% increase in session time was barely noticeable to drivers (extra 6 minutes on a 42-minute session). The $58,800 annual savings more than justified the $12,000 smart charging system investment-payback in under 3 months.
5. Implementation Considerations
5.1 Technology Requirements
Charger compatibility. OCPP 1.6J Smart Charging profile enables remote power allocation. Verify your chargers support this profile-Anari’s full product line (Pales, Aquila, Vulco, Fora) implements complete Smart Charging functionality.
Backend integration. Your charging management platform must support real-time power monitoring and dynamic allocation algorithms. Anari’s ANARI OS provides built-in load management; third-party platforms vary in capability.
Monitoring and alerts. Set demand thresholds and receive alerts before reaching limits. Proactive management prevents expensive peak events.
5.2 Common Pitfalls
Over-optimization. Aggressive throttling creates long sessions and driver complaints. Maintain minimum power thresholds (typically 30-50kW per charger) to ensure acceptable experience.
Ignoring battery characteristics. EV batteries naturally taper charging above 80% SOC. Fighting this physiology with artificial throttling creates frustration. Work with, not against, battery behavior.
Static rather than dynamic settings. Demand patterns change seasonally and operationally. Regularly review and adjust limits based on actual usage data.
5.3 Measuring Success
Track these KPIs monthly:
– Peak demand (kW) vs. contracted capacity
– Demand charge as percentage of total electricity cost
– Average session duration
– Charger utilization rate
– Driver satisfaction scores
Target: demand charge under 25% of total electricity cost (vs. industry average 35-45%).
6. The Transformer deferral calculation
Beyond monthly savings, load management defers capital expenditure:
Scenario: Your 800kVA transformer is approaching capacity during peak sessions. Without load management, you’d need a $45,000 upgrade within 18 months.
With load management: Peak demand stays at 600kW, well within transformer capacity. Upgrade deferred 5+ years, with interest and inflation increasing future upgrade cost to approximately $62,000.
Net benefit: $62,000 future cost avoided today + $58,800 annual demand savings = $120,800 total value over 5 years.
7. Conclusion
Demand charges represent a hidden tax on inefficient charging operations. Smart load management transforms this cost from unavoidable overhead into controllable variable-reducing bills by 30-50%, deferring infrastructure upgrades, and maintaining driver satisfaction.
The technology exists. The strategies are proven. The question is whether you’ll continue paying peak demand penalties or start managing your load proactively.
For CPOs operating multi-charger stations, load management isn’t optional-it’s essential infrastructure for profitable operations.