



1. The Gap Between Reported and Real Uptime
An operations dashboard shows a charger as “online.” The driver arrives, plugs in, and the session fails. The charger does not report a fault. It reports normal.
This is the single largest source of operator overconfidence. UC Berkeley’s 2023 field study of 655 public CCS DC fast charging ports in the San Francisco Bay Area found that only 73.3% could complete a two-minute charge test. The same operators self-reported 95-98% uptime over the same period. A 20+ percentage point gap between what the dashboard says and what drivers experience.
The gap is not primarily a hardware reliability problem. It is a monitoring problem. Most dashboards track connection state, not transaction success. A charger that communicates with the network but cannot initiate a charge session registers as “online” while delivering zero revenue.
2. What Actually Causes Downtime — and What Doesn’t
Downtime in DC fast charging falls into three categories, each requiring a different intervention:
Category 1: Power module failure (25-35% of downtime)
Power modules degrade over time. Heat, voltage spikes, and component aging reduce output. A module that degrades from 30kW to 15kW does not shut down — it continues to “work” at half power. The charger stays online, the driver charges slower than expected, and the operator sees no fault code. This is silent capacity loss, not hard downtime.
Category 2: Software and firmware issues (30-40% of downtime)
OCPP communication drops, firmware bugs in charge session management, database synchronization errors, and authentication failures account for the largest share of true faults. These are recoverable with remote intervention — if the operator knows they exist.
Category 3: Physical damage and environmental factors (20-30% of downtime)
Cable damage, connector wear, vandalism, weather ingress, and grid-side faults. These require on-site response and spare parts replacement.
Category 4: Network and connectivity (10-15% of downtime)
4G/5G signal loss, router failures, SIM card issues. Often misdiagnosed as charger faults because the charger appears offline.
The critical insight: Category 2 and Category 4 are preventable with proper monitoring. Category 1 is reducible with predictive maintenance. Category 3 is mitigated with site design and insurance. Most operators spend 80% of their maintenance budget on Category 3 and neglect the first two.
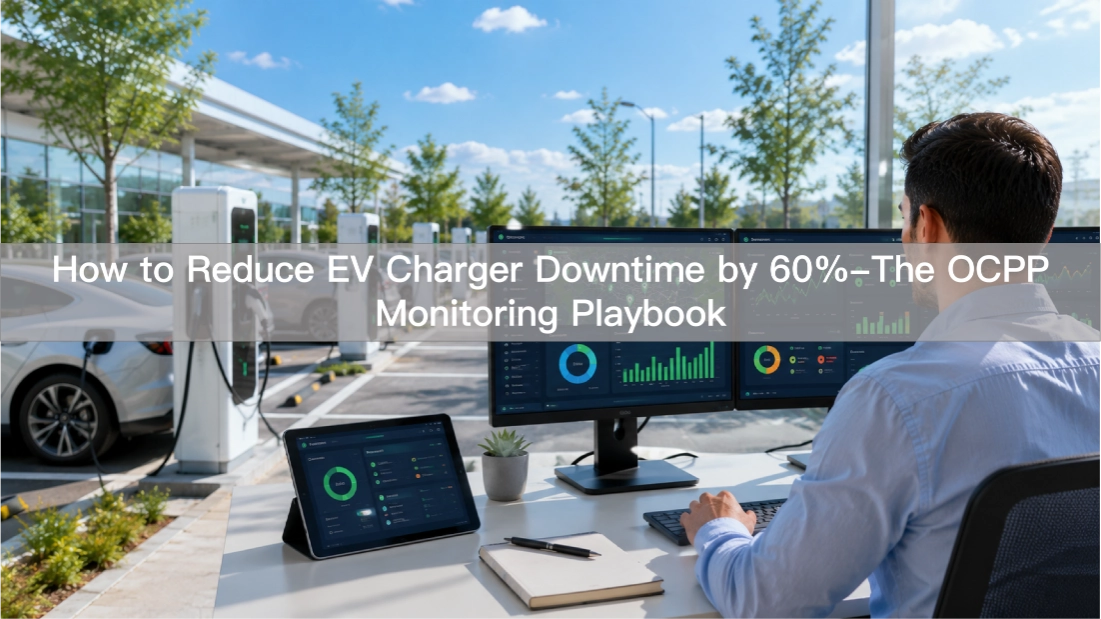
3. The OCPP Remote Monitoring Mechanism
OCPP 1.6J provides four profile-level monitoring capabilities that most operators underutilize:
Core profile — Real-time status:
Meter values, status notifications, heartbeat signals. The heartbeat interval (typically 60 seconds) tells you when a charger last communicated. If heartbeats stop, the charger is either offline or frozen. Most operators monitor heartbeats reactively — they notice when a ticket arrives, not before.
Local Auth List profile — Transaction control:
Manage which users and vehicles can authorize sessions. A compromised or misconfigured auth list can block legitimate users or allow unauthorized access. Remote list management prevents on-site visits for simple access changes.
Smart Charging profile — Load management and diagnostics:
This is the most underused profile. Smart Charging enables power allocation decisions, charging schedules, and — critically — remote firmware update triggers. A firmware issue causing a specific fault pattern can be diagnosed and patched without a truck roll. Smart Charging also lets you set power limits per stall, preventing thermal overload that accelerates module degradation.
Firmware Update profile — Over-the-air patches:
Remote firmware deployment is the single highest-ROI monitoring activity. A bug that causes 5% of sessions to fail at authorization can be patched across 50 chargers in one evening, eliminating what would otherwise be 50 separate site visits.
4. The 60% Reduction Framework
The 60% figure comes from combining three interventions that address the biggest downtime categories:
Intervention 1: Heartbeat monitoring with alerting (addresses Category 4 — 10-15% downtime)
Configure your CSMS to alert when a charger’s heartbeat interval exceeds 5 minutes. A frozen charger that stops sending heartbeats but remains powered is indistinguishable from an offline charger without this alert. Most native OCPP platforms default to daily heartbeat checks — upgrade to 5-minute intervals with instant alerting.
Intervention 2: Meter value differential analysis (addresses Category 1 — 25-35% downtime)
Compare meter values (kWh delivered) against session duration and power curves. If a charger reports 4 hours of session time but only 30kWh delivered (averaging 7.5kW), the module is degrading but the system does not flag it. Set a threshold alert: if average session power drops below 60% of rated capacity for three consecutive sessions, trigger a maintenance ticket. This catches silent degradation before it becomes a full failure.
Intervention 3: Automated firmware update scheduling (addresses Category 2 — 30-40% downtime)
Schedule firmware updates during low-traffic windows (typically 2am-5am local time). Use the OCPP Firmware Update profile to push updates in batches, monitoring success/failure rates per unit. A update that fails on 20% of units indicates a hardware-specific issue requiring investigation rather than a blanket re-push.
Combined, these three interventions address approximately 60-70% of downtime events before they reach the operator as a customer complaint. The remaining 30-40% (physical damage, environmental) requires on-site response and cannot be prevented by monitoring alone.
5. The Quarterly Maintenance Calendar
Remote monitoring catches problems early. Scheduled maintenance prevents them. A quarterly calendar aligned to seasonal stress points reduces unplanned downtime by an additional 15-20%:
Q1 (January-March): Post-winter inspection
• Check heater and thermal management systems (if equipped)
• Inspect cable integrity for cold-weather cracking
• Verify meter calibration certificates (annual verification typically required in Q1)
• Review firmware versions — apply any Q4 patches that were deferred for stability testing
Q2 (April-June): Pre-summer preparation
• Clean cooling fans and air filters (dust accumulation peaks in spring)
• Test thermal derating behavior at simulated high-ambient conditions
• Verify grid connection torque and terminal temperatures
• Update weather alerts configuration (monsoon/flood season prep for relevant regions)
Q3 (July-September): Peak-season readiness
• Full functional test of all chargers (every port, every session type)
• Spare parts inventory audit — reorder any module or connector types below threshold
• Review uptime logs from Q2 — identify recurring fault patterns
• Test backup communication paths (4G failover to LTE, or secondary SIM)
Q4 (October-December): Year-end optimization
• Annual meter calibration (required for revenue-grade accuracy in most markets)
• Review and update OCPP smart charging schedules for winter usage patterns
• Audit auth list configurations — remove stale user accounts, update vehicle whitelists
• Compile annual downtime report: categorize by type, calculate cost per event, set next year’s targets
6. Building the Downtime Cost Model
Reducing downtime by 60% translates to real revenue. But the revenue impact varies by site, so operators need a personal cost model:
Annual downtime cost formula: Cost = (Hours of downtime per year × Average revenue per hour) + (Downtime-related customer churn cost)
Example calculation:
• 10 chargers, 120kW each
• Average revenue per hour per charger: $8 (at $0.30/kWh × 25kW average session power)
• Current downtime: 156 hours/year per charger (≈18 days)
• 60% reduction target: 62 hours/year per charger (≈7 days)
• Revenue recovered: 94 hours × $8 = $752 per charger per year
• For 10 chargers: $7,520/year recovered from downtime reduction alone
Add the churn cost: each failed session drives a driver to a competitor. If 5% of failed sessions result in permanent customer loss, and each lost customer is worth $2,000/year in revenue, the churn cost of 156 hours of downtime could exceed $3,000/year. The total value of 60% downtime reduction is therefore $10,000+ per 10-charger site annually.
7. What Good Monitoring Looks Like in Practice
After implementing the framework above, a well-monitored site looks like this:
• 0-5 minutes: Charger fault detected via heartbeat gap or meter differential. Alert sent to operations team.
• 5-15 minutes: Remote diagnosis initiated. The technician reviews fault codes, recent session logs, and firmware version.
• 15-30 minutes: Decision made — remote patch applied (if firmware-related), or on-site dispatch scheduled.
• 30-60 minutes: If on-site required, technician en route with correct spare parts (module, connector, or board identified from remote diagnosis).
• 1-2 hours: Total resolution time for 80% of incidents, compared to 8-24 hours with reactive-only monitoring.
The difference is not the hardware. It is the speed at which the operator knows there is a problem and can act on it.
8. Common Monitoring Mistakes to Avoid
8.1 Monitoring connection, not transaction: A charger that connects but cannot charge is invisible to basic monitoring. Always correlate heartbeat data with meter values.
8.2 Ignoring silent degradation: A charger running at 60% power is not “half working” — it is a revenue leak. Set alert thresholds for power output, not just on/off status.
8.3 Reactive patching: Applying firmware updates only when a fault occurs means you are always behind. Schedule updates quarterly and deploy during low-traffic windows.
8.4 No spare parts strategy: Remote diagnosis is useless if the technician arrives without the right module. Maintain a regional spare parts inventory based on your fault rate data.
8.5 Treating all downtime equally: A 2-minute session failure and a 4-hour module replacement are both “downtime” in the dashboard, but they have very different root causes and prevention strategies. Categorize and prioritize.
*Data note: UC Berkeley field study on DC fast charger functional availability (Human Factors, 2023; San Francisco Bay Area data, 2022). OCPP profile descriptions reflect OCPP 1.6J specification. Cost model illustrations use example assumptions; substitute your site’s actual revenue per hour and downtime data for accurate calculations.*