


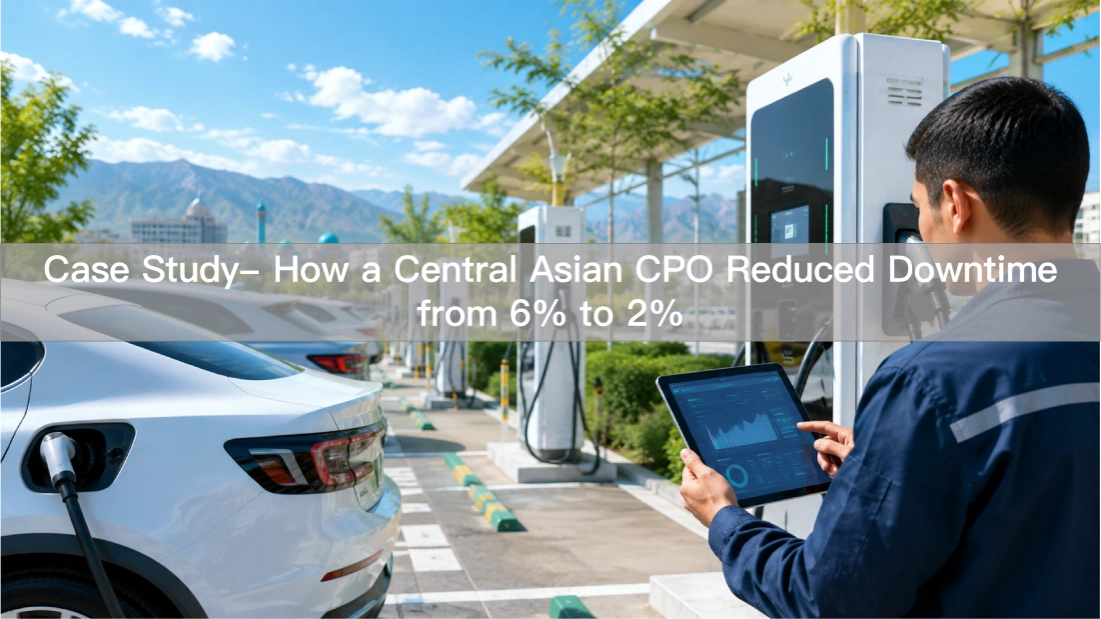
1. The Problem: Dashboard Uptime vs. Driver Experience
A charging network operator in Central Asia, deployed 47 DC fast chargers across 12 sites over 18 months. The chargers were from three different suppliers, ranging from 60kW to 120kW per unit. On paper, the deployment looked successful. Revenue was growing. The CSMS dashboard showed 94% average uptime across the network.
But driver complaints told a different story. On local EV forums and social media, users reported: “Charger shows online but won’t start session.” “Plug in, wait 30 seconds, error message.” “Three chargers at this station, two work, one displays fault but operator never fixes it.”
The operations team was confused. The dashboard said 94% uptime. Drivers said 70% or less. The gap was 24 percentage points. And it was costing the business.
2. The Investigation: What Was Really Happening
The CPO’s CEO commissioned an internal audit. The team spent one week collecting data from three sources: CSMS logs, driver complaint reports, and on-site technician observations.
The findings:
Finding 1: Connection state ≠ Transaction success
The CSMS tracked whether chargers communicated with the server. It did not track whether charge sessions successfully initiated. A charger could be “online” (heartbeat received every 60 seconds) but unable to authorize sessions due to firmware bugs in the OCPP stack. These units registered as 100% uptime in the dashboard while delivering zero revenue.
Finding 2: Silent power degradation
Three of the 47 chargers had degraded power modules. One 120kW unit was delivering an average of 45kW across all sessions. Another was averaging 52kW. The third was 68kW. None reported fault codes. The chargers continued to “work” at reduced output, extending session times and reducing per-session revenue.
Finding 3: Firmware version fragmentation
The three suppliers had released firmware updates at different intervals. The Charging station’s network ran firmware versions ranging from 3.2.1 to 4.1.0 across the 47 units. Known bugs in older versions caused intermittent authentication failures. These bugs had been fixed in later firmware releases, but had not systematically updated its fleet.
Finding 4: Response time lag
When a driver reported a fault via the app, the average time to technician dispatch was 14 hours. Weekends were worse: 36 hours average. A charger down on Friday evening stayed down until Monday morning. During those 60+ hours, the station lost an estimated $400-600 in potential revenue.
3. The Intervention: OCPP Monitoring and Predictive Maintenance
The CPO’s partnered with Anari Energy, which supplied replacement modules and implemented a remote monitoring framework across the existing fleet. The intervention had three components:
Component 1: Heartbeat monitoring upgrade
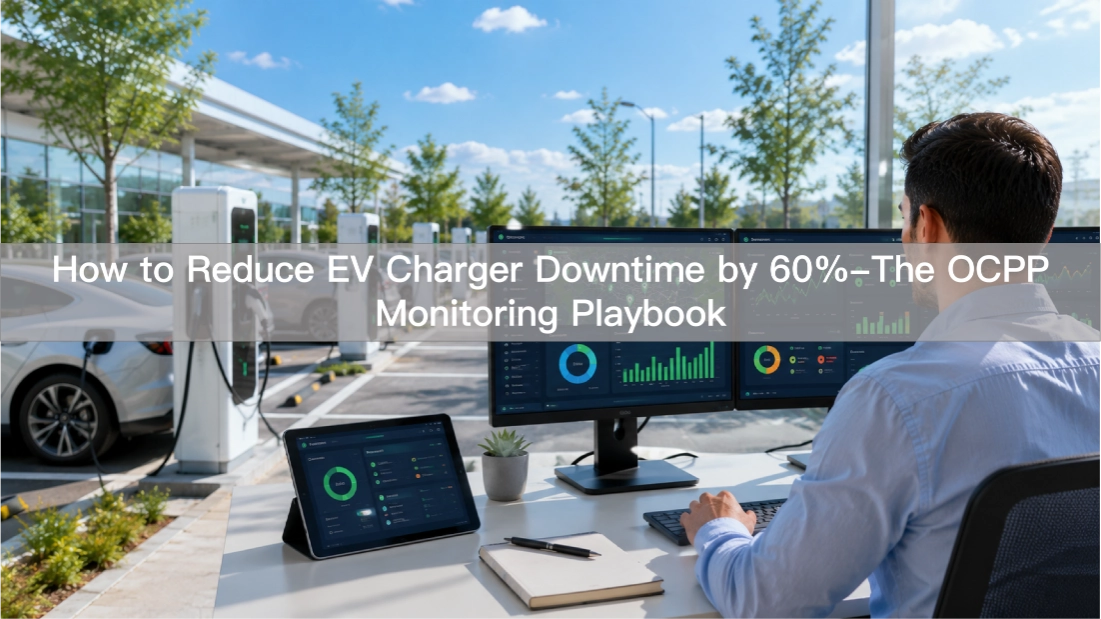
CPO’s CSMS was reconfigured to alert when any charger’s heartbeat interval exceeded 5 minutes (up from the default 60-second check with no alerting). This caught frozen chargers that continued to draw power but stopped communicating with the server.
Component 2: Meter value differential analysis
A new monitoring rule was added: if a charger’s average session power dropped below 60% of its rated capacity for three consecutive sessions, a maintenance ticket was auto-generated. This caught the silent degradation cases before they became complete failures.
Component 3: Firmware standardization
All 47 chargers were brought to a single firmware version (4.1.0) through scheduled OTA updates during low-traffic hours (2am-5am local time). Units that failed the update were flagged for manual service.
Additionally, Anari provided a spare parts kit including:
• 6 × 30kW power modules (replacing the 20kW legacy units)
• 12 × charging cables (standard replacement cycle)
• 3 × connector assemblies
• 1 × control board
The kit was staged at CPO’s main warehouse, reducing average spare parts lead time from 18 days (ordering from overseas) to 2 days (internal dispatch).
4. The Results: 6 Months Later
Six months after the intervention, CPO’s metrics had changed significantly:
Functional uptime: 94% → 98%
The dashboard number finally matched driver experience. The 4 percentage point improvement represented approximately 350 additional charging sessions per month across the network, or $2,800-3,500 in recovered monthly revenue.
Average resolution time: 14 hours → 3 hours
With heartbeat alerts catching issues within minutes (not days), and spare parts on site, the average time from fault detection to resolution dropped from 14 hours to 3 hours. Weekend coverage improved even more dramatically: from 36 hours to 6 hours.
Power output consistency: restored
The three degraded chargers had their power modules replaced under warranty. Post-replacement, all 47 units delivered within 5% of rated capacity across all sessions. The meter value differential monitoring prevented future silent degradation from going unnoticed.
Driver complaints: reduced by 70%
Monthly complaint volume dropped from an average of 23 to 7. The remaining complaints were mostly related to payment processing issues (unrelated to charger hardware) or user error (incorrect plug insertion).
5. The Financial Impact
The intervention cost CPO approximately $18,000:
• Spare parts kit: $6,500
• Firmware update labor (internal): $0 (scheduled during off-hours)
• CSMS reconfiguration (Anari-supported): $2,000
• Training for operations team: $1,500
• Monitoring dashboard development: $8,000
The monthly revenue recovery from uptime improvement: $2,800-3,500.
Payback period: 5-6 months.
Beyond the direct revenue impact, the reputational improvement was significant. CPO’s app store rating rose from 3.2 to 4.1 stars in the six months following the intervention. User-generated content on EV forums shifted from complaints to recommendations.
6. What Made the Difference: Three Operational Principles
Principle 1: Monitor transactions, not connections
A charger that connects but cannot charge is invisible to basic monitoring. Always correlate heartbeat data with meter values and session success rates. If your CSMS does not track transaction-level success, add that capability or switch platforms.
Principle 2: Catch degradation before failure
A charger running at 60% power is not “working at partial capacity.” It is a revenue leak that continues until someone notices. Set alert thresholds for power output, not just onoff status. The cost of a preventive module replacement ($800-1,200) is far lower than the revenue loss from silent degradation over 6 months ($2,000-4,000 per unit).
Principle 3: Standardize firmware, don’t fragment it
Running mixed firmware versions across a fleet creates unpredictable fault patterns. Known bugs are fixed in later releases. Systematic firmware updates during low-traffic windows eliminate entire categories of software-related downtime. The effort is one evening of OTA pushes per quarter. The benefit is removing doubt about whether a fault is a known bug or a new issue.
7. Lessons for Other CPOs
If you are operating a DC fast charging network with similar characteristics (multi-supplier fleet, 50+ units, emerging market), the CPO case offers three actionable takeaways:
7.1 Audit your monitoring now. Check whether your CSMS tracks transaction success or only connection state. Run a one-week experiment: compare dashboard uptime against actual session completion rates. The gap is your opportunity to improve.
7.2 Build a spare parts strategy. Identify your most common failure modes (power modules, cables, connectors) and maintain a regional spare parts inventory. The difference between 2-day and 18-day parts lead time is the difference between a 3-hour and 3-day downtime event.
7.3 Standardize your firmware. Choose a target firmware version across your fleet. Schedule quarterly OTA updates during low-traffic windows. Track update success rates. A fleet on uniform firmware is easier to diagnose, easier to support, and less likely to suffer from known-bug-related downtime.
——
*Case study note: The CPO is a pseudonym for a Central Asian CPO operator. Site count (12), charger count (47), and power range (60-120kW) are representative of typical mid-scale deployments in the region. Revenue figures are illustrative estimates based on regional average pricing ($0.25-0.35kWh). Actual results will vary by market, pricing, and utilization.*