



1. The Uncomfortable Truth About Utilization
A charging station’s financial viability depends on one number: utilization. Not revenue, not profit, not growth potential. Utilization.
Utilization is defined as energy actually delivered divided by theoretical maximum output. A 120kW charger running at an average of 60kW for 4 hours per day delivers 240kWh daily. Its theoretical maximum is 122kW × 24 hours = 2,880kWh. Daily utilization is 8.3%.
Public fast-charging sites in emerging markets typically operate at 5-12% utilization. This is not an anomaly. It is the industry’s operating reality.
Here is the uncomfortable truth: utilization is largely decided before construction begins. Site selection determines approximately 80% of a charging station’s eventual utilization. Operations can recover perhaps 20% through pricing, scheduling, and marketing. The remaining 80% is locked in by the location, the surrounding traffic patterns, and the grid capacity available at that address.
Most operators optimize the 20% and wonder why the 80% does not improve. The following five variables explain why.
2. Variable 1: Real Vehicle Traffic, Not Potential Traffic
The most common site selection error is counting petrol station traffic and assuming it translates to EV charging demand. Petrol traffic is not charging demand. A highway rest stop with 10,000 vehicles per day selling 8,000 liters of diesel is not automatically a good charging site.
Real traffic means confirmed or highly probable EV presence. The indicators are:
• Existing EV registrations in the catchment area: Municipal or national transport databases often publish EV registration data by region. A city with 2% EV penetration and accelerating growth is a stronger signal than one at 0.5%.
• Existing charging infrastructure density: If there are already 5 DC fast chargers within 3km, there is demonstrated demand. If there are zero, you are either first-mover (high risk, high reward) or the market is not ready.
• Fleet operations in the area: Delivery vans, ride-hailing vehicles, and municipal fleets are the earliest and most consistent EV adopters in emerging markets. A logistics hub or ride-hail depot nearby is a stronger signal than residential EV ownership alone.
The question to ask: What is the actual EV traffic within a 3km radius of this site, and how fast is it growing? Not how many cars pass by. How many EVs pass by, and how many of them charge here rather than at a competitor’s station?
3. Variable 2: Dwell Time and Purpose
Charging behavior differs fundamentally between en-route users and destination users. En-route users want speed. They arrive with low State of Charge, plug in, and leave as soon as the battery reaches 80%. Their dwell time is 20-40 minutes. Destination users arrive with sufficient charge, plug in for the duration of their visit, and may stay 1-4 hours.
This difference determines hardware selection, pricing strategy, and ultimately utilization.
En-route sites (highways, major corridors): Need high-power DC fast chargers (120-350kW), multiple stalls for queue management, and pricing that reflects time sensitivity. Utilization is driven by volume of passing traffic and reliability — a broken charger on a highway corridor loses drivers permanently.
Destination sites (malls, offices, hotels, retail): Need moderate-power DC (30-60kW) or AC Level 2. Utilization is driven by dwell time and foot traffic. A mall charger used for 2 hours at 7kW delivers more total energy than a highway charger used for 20 minutes at 150kW, even though the highway charger has higher peak power.
The mistake: installing 180kW chargers at a destination site where users park for 2 hours. The extra power is wasted. Or installing 60kW chargers on a highway where drivers will route around to a competitor with faster charge rates.
The question to ask: What is the primary purpose of visits to this site? How long do people stay? What power level matches that dwell time?
4. Variable 3: Grid Capacity and Connection Timeline
Grid connection is the silent killer of charging station projects. A site may have perfect traffic patterns, ideal dwell time, and competitive positioning. If the grid cannot deliver the required power, or if the connection queue is 18 months long, the project dies before it starts.
Transformer capacity determines the maximum simultaneous charging power a site can deliver. A 100kVA transformer can support approximately 80kW of continuous DC fast charging (accounting for losses and power factor). A 250kVA transformer supports roughly 200kW. Upsizing the transformer is often the single largest capital cost after the chargers themselves.
Connection timeline matters as much as capacity. In congested European markets, grid connection queues exceed 36 months in prime locations. Emerging markets vary widely — some utilities can connect within 3 months, others take 12-18. Every month of queue time is capital sitting idle, earning nothing.
The question to ask: What is the available grid capacity at this address? How long will the connection process take? What is the cost of transformer upsizing if the default capacity is insufficient?
Get this answer in writing from the utility before signing any lease. A verbal promise from the property owner about “available power” is not a grid connection commitment.
5. Variable 4: Competitor Density and Differentiation
Competitor presence is a double signal. Zero competitors within 3km means either untapped demand or no demand. Five competitors means demonstrated demand but also price pressure and market saturation.
The useful metric is not the number of competitors, but their utilization and reputation. A competitor with 80% utilization and 4.5-star reviews is a strong market — your site needs to be better positioned to capture share. A competitor with 5% utilization and 2-star reviews is a warning sign — the market may not support another player.
Differentiation strategies when competitors exist:
• Price: Only viable if your unit economics allow it. Race-to-the-bottom pricing destroys margins for everyone.
• Reliability: Your chargers work when theirs don’t. This is the strongest differentiator in emerging markets where downtime averages 20-30%.
• Speed: Higher power output for time-sensitive users.
• Experience: Better physical environment (lighting, security, amenities) that makes charging feel safe and comfortable.
• Payment flexibility: Multiple payment methods, roaming agreements, fleet billing options.
The question to ask: What are the top 3 competitors within 3km, what is their average utilization, and what are their consistent complaints (from reviews, social media, or direct observation)? Where is the gap?
6. Variable 5: Lease Duration and Renewal Risk
A lease shorter than your projected payback period is not a site. It is a liability. If the landlord declines to renew, or if the anchor tenant exits, your charging infrastructure becomes stranded — expensive to remove, impossible to move economically.
Typical payback periods for DC fast charging in emerging markets range from 3-5 years at healthy utilization (10%+), stretching to 7-10 years at lower utilization (5-7%). Your lease should extend at least 2 years beyond your expected payback, providing a buffer for the profitable portion of the asset’s life.
Lease structure matters:
• Minimum term: Should cover payback period plus 2 years
• Renewal options: At least one 5-year renewal option with pre-agreed terms
• Exit clauses: Clear terms for early termination if grid connection is delayed beyond a specified period
• Power inclusion: Ensure the lease specifies available power capacity and any exclusivity provisions
The question to ask: What is the lease term? What are the renewal conditions? What happens to the chargers if the lease ends before payback?
Get legal review on the lease before signing. The cheapest lease is the one that lets you operate for 7 years without renegotiation.
7. The Site Selection Decision Matrix
Combine the five variables into a scoring framework before visiting any site:
| Variable | Weight | Score 1-5 | Weighted Score |
| Real EV traffic | 25% | ||
| Dwell time matc | 20% | ||
| Grid capacitytimeline | 25% | ||
| Competitor positioning | 15% | ||
| Lease security | 15% | ||
| Total | 100% |
A site scoring below 3.0 (out of 5.0) should not proceed to lease negotiation. A site scoring 3.0-3.5 needs mitigation plans for the weak variables. A site scoring above 3.5 is worth the investment of a formal site survey.
This matrix prevents the most common mistake: falling in love with a location’s aesthetics or the landlord’s enthusiasm, and ignoring the five variables that actually determine financial viability.
8. Before You Visit: The Remote Screening Process
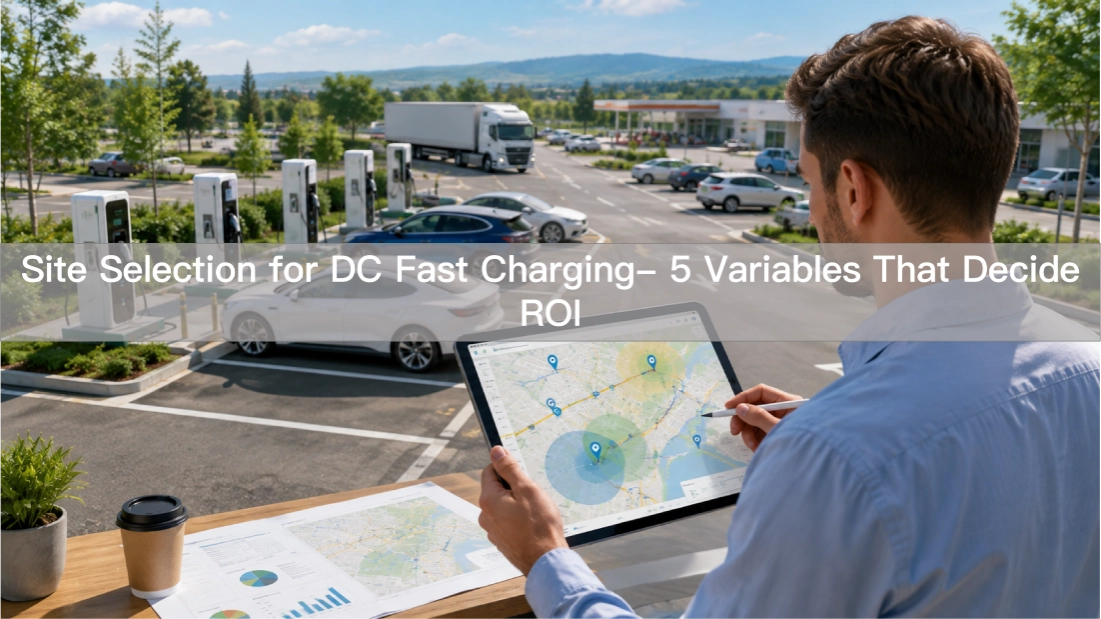
You do not need to drive to every potential site to evaluate it. A remote screening process filters out weak candidates before you invest travel time:
8.1 EV registration data: Pull regional EV registration statistics from government sources. Identify corridors and districts with the highest density and growth rate.
8.2 Competitor mapping: Use Google Maps, PlugShare, or local charging apps to identify existing DC fast chargers within target areas. Note power levels, user ratings, and apparent utilization (cars plugged in during peak hours).
8.3 Traffic volume data: Some municipalities publish annual average daily traffic (ADT) counts by road segment. Cross-reference with EV-friendly routes.
8.4 Contact: Call the local utility’s commercial connection department. Ask about connection queue times and standard transformer capacities for commercial sites in your target area.
8.5 Lease market scan: Check commercial real estate listings for available sites in target locations. Note asking rents, lease terms, and power specifications.
Sites that pass remote screening proceed to on-site visit. Sites that fail should not receive a site visit budget.
9. Summary: The Utilization Equation
Utilization = f(traffic, dwell time, grid capacity, competition, lease security)
Operations can optimize the function’s output by 20%. Site selection determines the function’s input. Most operators spend their energy on the 20% and neglect the 80%.
Before signing a lease, before ordering chargers, before anything else: answer the five questions above. The answers determine whether you are building a business or a liability.
*Data note: Utilization ranges (5-12% for emerging market public DC fast charging) reflect industry observations from multiple markets. Payback period estimates (3-10 years) are illustrative and depend on local electricity costs, pricing, and capital costs. Grid connection timelines vary widely by utility and market; verify locally.*