


1. The $2M Mistake That Happens Every Week
A CPO in East Africa leases land near a new highway interchange. The site looks perfect-high visibility, easy access, growing traffic. They install eight 120kW chargers. Six months later, the station averages 18% utilization. The math doesn’t work. Not because the chargers are bad, but because the site selection missed three invisible variables: grid capacity constraints, competitor expansion timelines, and dwell-time patterns that don’t match fast-charging behavior.
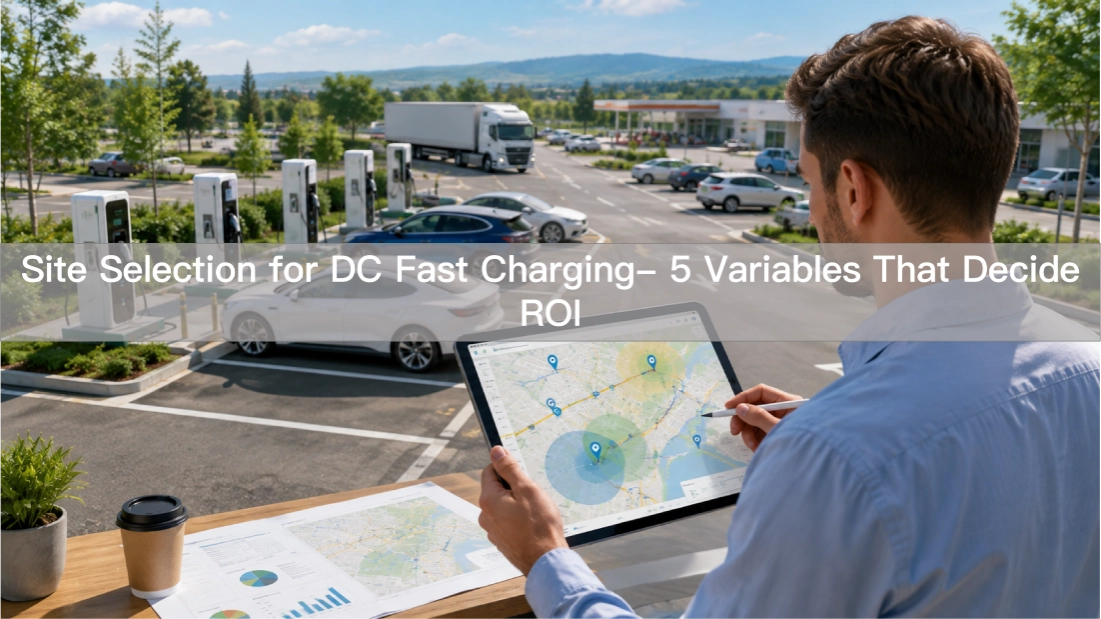
Site selection determines 60-70% of a charging station’s revenue potential before a single cable is unboxed. The difference between a profitable station and a money pit often comes down to five quantifiable variables-not intuition, not “good location,” but data-driven analysis of traffic flows, grid infrastructure, competitive landscape, real estate economics, and driver behavior patterns.
This guide breaks down each variable with the frameworks Anari uses across 22 markets, from Georgia to Kenya to Romania.
Variable 1: Grid Capacity and Transformation Cost
The most common site selection mistake isn’t about traffic or competition-it’s about grid capacity. A 120kW DC fast charger drawing power from a weak grid connection faces two problems: thermal throttling during peak hours, and expensive transformer upgrades that can cost $15,000-$50,000 depending on distance to the substation.
1. Utility consultation. Contact the local electricity provider 60-90 days before site commitment. Request the available capacity at the address and the cost/proximity of transformer upgrades if needed.
2. Load profiling. Analyze the site’s existing electrical load (if commercial) or projected load (if greenfield). A retail location with HVAC and lighting already drawing 80kW has less headroom than an empty lot.
3. Temporary power options. Some markets allow temporary transformer installation during construction-cheaper than permanent upgrades, but only viable if the utility supports it.
4. Time-of-use alignment. Match charger operating hours with off-peak electricity rates where available. A station running primarily overnight or midday can access 30-50% lower rates.
Variable 2: Traffic Volume and Driver Behavior Patterns
Traffic volume alone is misleading. 10,000 cars passing a site daily means nothing if they’re all local commuters making 2km trips. What matters is the intersection of three factors: vehicle type mix, trip length distribution, and dwell-time compatibility.
– Heavy vehicle percentage. Trucks, buses, and delivery vans consume 3-5x more energy per trip than passenger EVs. A site near a freight corridor or logistics hub will have different utilization patterns than one near residential areas.
– Trip length correlation. Drivers undertaking 150km+ trips are far more likely to stop for fast charging than those making 50km journeys. Highway-adjacent sites capture this high-intent segment.
– Dwell-time matching. Fast charging (15-45 minute sessions) competes with coffee, restrooms, and retail. Sites that can’t offer these amenities-even basic ones like a vending machine and sheltered waiting area-lose drivers to competitors who can.
– Daily traffic count × EV penetration rate × fast-charging intent ratio
– Seasonal variation (tourist destinations spike in summer; industrial areas stay stable)
– Competitor proximity (each competitor within 5km reduces expected utilization by 8-12%)
A site with 8,000 daily vehicles, 15% EV penetration, and 20% fast-charging intent yields approximately 240 potential charging sessions daily. At 40kWh average session and $0.25/kWh margin, that’s $2,400/day gross revenue-if utilization holds. Reality typically lands at 40-60% of theoretical due to behavioral factors, so plan for 96-144 sessions daily.
Variable 3: Competitive Landscape and First-Mover Timing
Competitor analysis isn’t just about counting existing chargers-it’s about timing, positioning, and expansion pipelines.
1. Existing inventory. Map all DC fast chargers within 5km radius. Note power levels, availability status, pricing, and payment methods. Tools like PlugShare, ChargeLab, and A Better Route Planner provide partial data; local operator websites and government databases fill gaps.
2. Announced expansions. Check municipal planning records and developer announcements for planned stations. A competitor breaking ground today may be operational in 6-9 months, changing your utilization projections significantly.
3. Differentiation opportunities. Identify underserved segments: heavy-duty truck charging, fleet depot solutions, or premium amenities. A site surrounded by basic 50kW chargers might support 150kW+ units with better waiting facilities.
4. Co-location advantages. Sites near complementary businesses-truck stops, shopping centers, hotels-benefit from shared traffic. A charger at a gas station captures drivers already planning to stop; a standalone station requires deliberate destination behavior.
Variable 4: Real Estate Economics and Lease Structure
Land costs vary dramatically even within the same city. A site 2km apart might differ in price by 300% based on zoning, visibility, and access. But the cheapest land isn’t always the best economics.
– Minimum guarantee vs. revenue share. Many landlords prefer fixed monthly rent ($2,000-$8,000/month depending on location) over percentage deals. Calculate break-even utilization: at $4,000/month rent and $0.25/kWh margin, you need 128,000 kWh monthly throughput-roughly 6 chargers at 50% utilization.
– Duration and renewal terms. Secure 10-15 year leases with renewal options. Shorter terms risk displacement after you’ve built customer base. Renewal clauses should cap annual increases at 3-5%.
– Expansion rights. Ensure the lease allows adding more chargers or upgrading power capacity without renegotiation. A site that can scale from 4 to 8 chargers has significantly better unit economics.
– Utility access. Confirm the landlord facilitates transformer upgrades and provides necessary easements. Some properties have restrictive covenants that complicate electrical work.
– Signage and visibility. Hidden sites require heavy marketing spend to drive traffic. Visible, accessible locations command premium rents but deliver higher utilization.
Variable 5: Regulatory Environment and Permitting Timeline
Permitting timelines vary from 2 months in progressive markets to 18+ months in bureaucratic ones. These delays burn holding costs and miss market windows.
– Zoning compliance. Verify the site is zoned for commercial EV charging. Some industrial or mixed-use zones require variances or rezoning-processes that can add 6-12 months.
– Environmental review. Sites near waterways, wetlands, or historic districts may trigger additional reviews. Greenfield developments often face stricter scrutiny than brownfield retrofits.
– Interconnection approval. Utility interconnection applications can take 3-6 months. Start this process early-in parallel with lease negotiations-to compress the overall timeline.
– Incentive eligibility. Some regions offer grants, tax credits, or reduced permitting fees for EV infrastructure. Factor these into the pro forma-they can improve ROI by 15-25%.
The Site Selection Scorecard
Combine these five variables into a weighted scorecard for objective comparison:
| Variable | Weight | Score (1-10) |
| Grid capacity & upgrade cost | 25% | |
| Traffic & driving behavior | 25% | |
| Competitive landscape | 20% | |
| Real estate economics | 15% | |
| Regulatory environment | 15% | |
| Total | 100% |
Sites scoring below 6.0 should be deprioritized unless strategic factors (landownership, partnership, expansion option) justify the risk. Scores above 7.5 typically support profitable deployment within 24-36 months at realistic utilization assumptions.
Conclusion
Site selection isn’t a guessing game-it’s a structured analysis of five quantifiable variables. The operators who systematize this process using data, not intuition, consistently outperform those who pick sites based on visibility or land cost alone.
Before committing to any location, run the grid assessment, traffic analysis, competitive map, lease evaluation, and regulatory check. The 3-6 months spent on thorough site selection saves years of underperformance and hundreds of thousands in lost revenue.