



You approved $200,000 for six DC fast chargers in a parking lot on the edge of town. The sales rep promised three-year payback. Two years later you open the books: charging revenue is not even twice the electricity bill, and after rent and platform fees the site is losing money. The chargers work. Drivers show up. The problem is how you do the math.
The common approach is “spread × volume”: price gap times energy sold. Three numbers actually decide whether this investment survives: utilization, spread, and the break-even line. Most CPO finance teams track the first two, and both are usually computed wrong.
1. Where the money comes from, and where it goes
The financial structure of a DC fast charger is simple: Revenue = energy sold (kWh) × retail price ($/kWh)
Costs fall into four buckets:
• Electricity: the cost of buying power, scales with volume
• Platform and payment fees: typically 3-8% of revenue
• Site rent: fixed
• Operations, maintenance, and downtime losses: partly fixed, partly fault-driven
Net profit = revenue − electricity − these four buckets.
Most finance teams treat “retail price − tariff” as gross margin, multiply by volume, and the model looks fine. The true margin is roughly 40% below the paper number. We will show the deduction stack shortly. First, the variable that matters most.
2. Utilization is the lifeline, not a marketing term
Utilization = energy actually delivered ÷ theoretical maximum (rated power × 24 hours × 365 days).
Take a 120kW unit that averages 60kW output for 4 hours a day. Daily delivery is 240kWh. The ceiling is 120 × 24 = 2,880kWh per day. Utilization = 240 ÷ 2,880 = 8.3%.
Public fast-charging sites in emerging markets typically run at 5-12%. That is not an anomaly. That is the industry’s operating reality.
Utilization drives payback exponentially, not linearly, because the largest share of a charger’s cost is fixed. The equipment depreciates and the rent accrues whether anyone plugs in or not. The same unit:
• 5% utilization: 7-8 years to payback
• 10% utilization: 3-4 years
• 15% utilization: 2-2.5 years
Raising utilization from 5% to 10% more than halves the payback period. That is the KPI your CFO should watch: not “how many units did we install this year,” but “how many kWh does each installed unit sell per day.”
3. The real spread: deduct six layers before you multiply
Spread = retail price − true cost per kWh.
The true cost per kWh is not the tariff. Work down from the retail price, layer by layer:
• Tariff: what you pay for electricity
• Line losses and station self-consumption: typically 3-5%
• Platform subscription: per kWh or monthly
• Payment processing: 2-4%
• Taxes: VAT and other levies
• Bad debt and unsettled charges: unavoidable in pay-later models
Worked example, with figures you should replace with your own tariff and fees:
• Retail price: $0.30/kWh
• Tariff: −$0.10/kWh
• Line loss 4%: −$0.012
• Platform fee 3%: −$0.009
• Payment fee 3%: −$0.009
• Tax 5%: −$0.015
• True gross margin: $0.155/kWh
The paper spread of 0.30 − 0.10 = $0.20 shrinks to $0.155 after the deductions: 22% gone before a single kWh is sold. And margin is fragile: every $0.05 of spread shortfall stretches payback from 3 years to 4.5 years. In markets where tariffs move quarterly, that $0.05 is easy to lose.
4. Translate payback into kWh sold per day
CFOs think in years-to-payback. Operations teams cannot watch “years” every day. Translate the payback target into a number an operator can track:
Daily break-even energy = annual fixed cost ÷ (365 × true gross margin per kWh)
Worked example:
• Annual fixed cost: $5,000 depreciation + $5,000 rent + $2,000 O&M = $12,000
• True margin per kWh: $0.155
• Daily break-even energy = 12,000 ÷ (365 × 0.155) ≈ 212 kWh/day
A 120kW unit must sell at least 212kWh a day, roughly 2-3 full charges, just to stop losing money. Below that line, every kWh sold loses money: revenue appears on the books, profit does not.
Put this number on the agenda of the monthly operating review. A site sitting below its break-even line is not “the market is slow.” Every transaction is losing money. That is a pricing decision or a site decision, not a patience decision.
5. You paid for 120kW. You may only be able to sell 40kW
The mismatch finance teams miss most often: nameplate power ≠ sellable power.
A unit labeled 120kW delivers less in practice, limited by three factors:
• Grid capacity: an undersized transformer or feeder forces the unit to derate
• Vehicle acceptance: many cars only accept 50-100kW, some as low as 40kW
• Thermal derating: high ambient temperatures make the unit cut output to protect itself
A 120kW charger on a 150kVA transformer is the standard pairing. If the site has only 100kVA of spare capacity, the unit will realistically deliver 60-70kW. You paid for 120kW and sell 60kW of energy every day.
Before you sign, ask the supplier in writing: what sustained output will this unit deliver under my grid conditions? Only a number the supplier is willing to put in the contract counts.
6. One unit or several: spread the fixed cost
Fixed costs (transformer, grid upgrade, site works, installation) can exceed half of total capex. Four units sharing one transformer reduce that share to a quarter.
That is why “start with one unit to test the market” is usually wrong financially. A single unit carries the highest fixed-cost ratio, the lowest utilization, and the slowest payback. Either do not build, or build at a scale that spreads the fixed cost.
Multi-unit sites add a second benefit beyond unit economics: redundancy. When one unit fails, the others absorb the traffic, and downtime losses drop sharply.
7. Storage is a spread lever, with conditions
In markets where the peak-valley price gap exceeds $0.10/kWh, adding storage changes the game: buy at off-peak rates, store the energy, sell it at peak prices. The chargers do not move, but the effective spread widens.
Storage is extra capex. It pays only when the price gap is wide enough and the daily cycle count is high enough. Model it properly before committing; a guess is not a model. Done right, storage pushes the 212kWh break-even line down. Done wrong, it becomes another unrecoverable investment.
8. How to use this piece
• Run your real tariff and rent through the daily break-even formula
• Have operations report actual daily output every week against the break-even line
• Four consecutive weeks below the line: adjust pricing, move the site, or remove the units
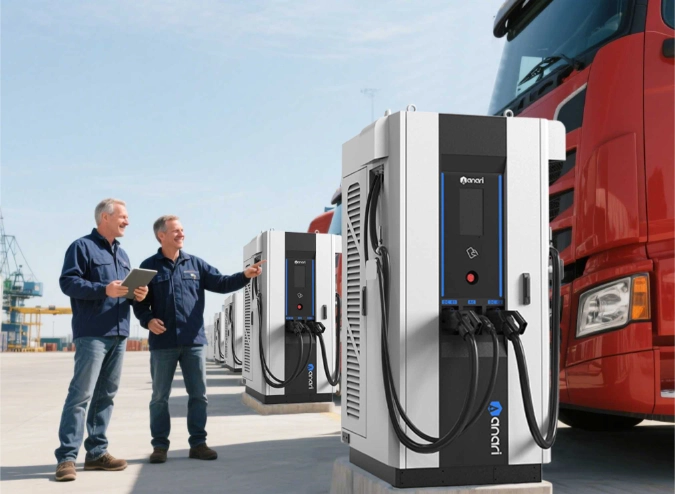
Anari Energy’s 60-480kW Integrated Floor-Mounted DC EV Charging Station
Anari Energy DC fast chargers run OCPP 1.6J, are not locked to any platform, ship in about 30 days, and include dynamic load balancing (DLB) to sell more energy when grid capacity is tight. Want your own break-even line? Send us your tariff, rent, and expected utilization, and we will return a sensitivity analysis with a working calculator.