



1. The Purchase Price Distraction
A CPO reviewing three DC fast charger quotations will immediately notice the price difference. Supplier A quotes €18,000 per 120kW unit. Supplier B quotes €21,000. Supplier C quotes €16,500.
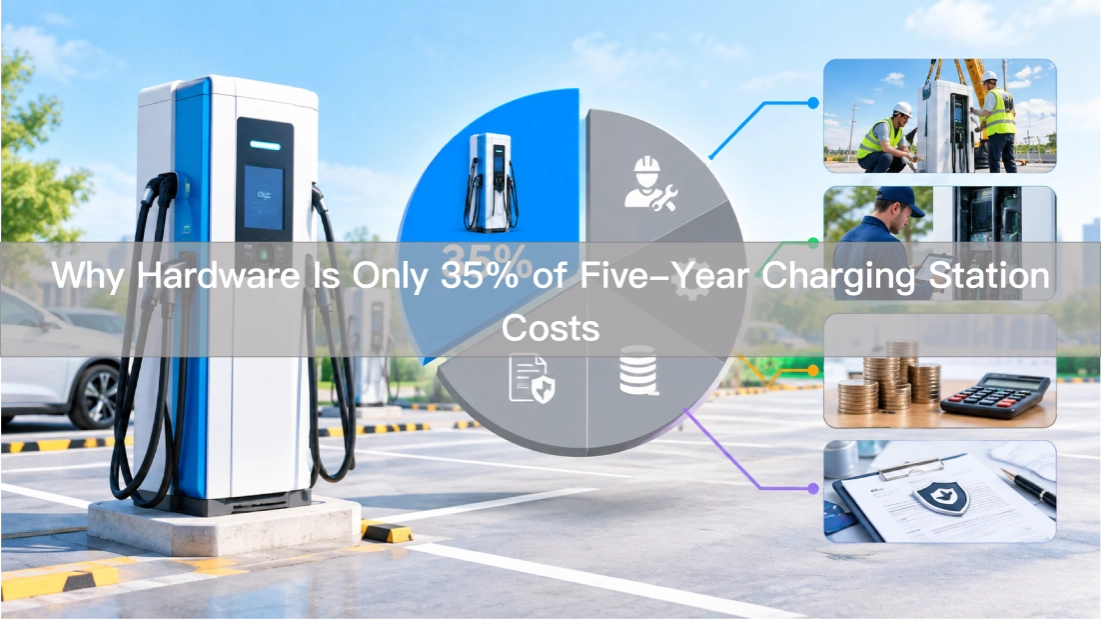
The procurement instinct is to compare unit prices and select the lowest number. But unit price is the most visible and least informative metric in charging infrastructure procurement. It represents approximately 35% of total cost over a five-year horizon. The other 65% is hidden in operational expenses that do not appear on a purchase order.
Understanding the TCO breakdown is essential for making a procurement decision that minimizes five-year cost rather than minimizing first-year spend.
2.The Five-Year Cost Breakdown
A typical five-year TCO model for a DC fast charger deployment includes the following cost categories:
Hardware acquisition (35%): The purchase price of the chargers, including connectors, cables, and any required accessories. This is the line item that appears on the quotation and dominates initial evaluation.
Installation and commissioning (8%): Site preparation, electrical infrastructure upgrades, civil works, and initial setup. Installation costs vary significantly by site condition but are generally proportional to hardware cost.
Energy losses (15%): Charger efficiency determines how much input energy is converted to useful charging output. A charger rated at 96% efficiency at nominal output loses 4% of purchased energy to heat. At high utilization, that loss compounds significantly. Over five years, a 4% efficiency gap between a 92% charger and a 96% charger can represent tens of thousands of euros in excess energy costs.
Maintenance and repairs (22%): Reactive maintenance, preventive servicing, and replacement parts. Failure rate directly drives this category. A charger with 8% failure rate generates roughly four times the maintenance dispatches of a charger with 2% failure rate. Each dispatch includes labor, travel, and parts costs.
Downtime revenue loss (20%): When a charger is non-operational, it generates zero revenue. At 8% failure rate across a fleet, the cumulative revenue loss over five years can exceed the original hardware investment. At 2% failure rate, the same fleet preserves significantly more income.
3. Where the Real Savings Live
The procurement team that focuses only on hardware acquisition is optimizing for the wrong variable. The TCO analysis reveals that the largest cost categories — energy losses, maintenance, and downtime — are determined by hardware quality, not hardware price.
A more expensive charger with higher efficiency, lower failure rate, and better remote diagnostics will typically have a lower five-year TCO than a cheaper charger with mediocre efficiency and high field failure rates. The price difference is recovered within 18 to 36 months of operation through reduced energy waste, fewer service calls, and higher station availability.
Anari’s field data from deployments in Georgia, Romania, Czech Republic, and Finland shows average failure rates below 2% and sustained efficiency above 96% at normal output power. These specifications translate directly into the cost categories that dominate TCO.
4. The Efficiency Multiplier
Energy efficiency is the most commonly misunderstood TCO variable. A 96% efficient charger converts 96 cents of every euro of purchased electricity into charging revenue. A 92% efficient charger converts only 92 cents. The 4% gap sounds small until you multiply it by annual energy throughput.
A 120kW charger operating at 30% average utilization in a high-traffic location processes approximately 100,000 kWh annually. At €0.25 per kWh, that is €25,000 in energy costs. The 4% efficiency difference represents €1,000 annually, or €5,000 over five years per charger.
Across a fleet of 50 chargers, that is €250,000 in cumulative energy cost difference. The efficiency specification on the datasheet is not a technical detail. It is a financial performance indicator.
5. How to Build Your Own TCO Model
The formula is straightforward:
Five-Year TCO = Hardware + Installation + (Annual Energy Cost × 5) + (Annual Maintenance Cost × 5) + (Annual Downtime Revenue Loss × 5)
Annual energy cost = Annual kWh throughput × Energy price × (1 − Charger efficiency)
Annual maintenance cost = Number of chargers × Failure rate × Average dispatch cost
Annual downtime revenue loss = Number of chargers × Failure rate × Average daily revenue per charger × 365
Plug in your actual numbers — utilization rates, energy prices, local labor costs — and the comparison between charger options becomes a financial calculation rather than a price comparison.
The charger with the lowest purchase price will rarely produce the lowest five-year TCO. The charger with the highest efficiency, lowest failure rate, and best remote support typically does.
6. The Procurement Implication
When you evaluate DC fast charger suppliers, ask them to provide the specifications that drive TCO, not just the unit price:
- Sustained efficiency at your operating climate (not just lab ratings at 25℃)
- Field-verified failure rate from deployments in similar conditions
- Remote diagnostics capability and average resolution time
- Local warranty execution network and spare parts availability
- OCPP profile coverage (Core + Smart Charging + Firmware Update + Local Auth List)
These specifications determine the 65% of your cost that has nothing to do with the purchase price. Ignoring them in favor of a lower unit quote is optimizing for the wrong variable.
7. A Real-World TCO Comparison
Consider two hypothetical 120kW DC fast chargers from different suppliers:
| Cost Category | Supplier A (Low Price) | Supplier B (Premium) |
|---|---|---|
| Unit price | €16,500 | €19,200 |
| Efficiency | 92% | 96% |
| Failure rate | 8% | 2% |
| Annual energy cost (100MWh) | €26,042 | €25,000 |
| Annual maintenance (8% rate) | €9,600 | €2,400 |
| Annual downtime loss (8% rate) | €43,800 | €10,950 |
| 5-year TCO per unit | €142,210 | €121,750 |
Supplier A costs €2,700 less upfront but €20,460 more over five years. The total cost difference is 14.4%, entirely driven by operational performance, not purchase price.
This is not a theoretical exercise. It reflects the actual cost dynamics observed across Anari Energy deployments comparing our units against competitors with higher reported failure rates and lower sustained efficiency.
The procurement team that evaluates only unit price is making a calculation error that compounds over the life of the asset.
These specifications determine the 65% of your cost that has nothing to do with the purchase price. Ignoring them in favor of a lower unit quote is optimizing for the wrong variable.
Data note: TCO percentages reflect Anari Energy analysis of deployed DC fast charger fleets across European and emerging market sites. Efficiency and failure rate figures are based on field measurements, not manufacturer specifications.